GitLab Usage Analysis
Professional GitLab data analysis tool that can collect, analyze and visualize your GitLab project data. Through Elasticsearch storage and Grafana dashboards, it provides comprehensive project usage insights, including commit trends, project activity, user contribution analysis and merge request statistics.
Core Use Cases
AI Programming Efficiency Assessment
Quantify the efficiency improvements brought by AI programming assistants. Compare developers' code commit frequency, lines changed, merge request changes before and after using AI to demonstrate the value and efficiency improvements of AI tools.
Developer Activity Monitoring
Real-time monitoring of development team member work status, alerting for long-term non-committing personnel to avoid code asset loss risks due to local development habits.
Project Health Management
Continuously track project activity levels, identify long-term inactive projects and clean them up timely to optimize resource allocation and avoid maintenance cost waste.
Merge Request Process Optimization
Monitor merge request processing status and cycles, follow up on long-term unresolved MRs timely to improve code review efficiency and release process control.
Code Quality Risk Identification
Identify potential code quality risk points by analyzing commit frequency, code change scale and review cycles, establishing preventive quality control systems.
Project Investment Analysis
Scientifically evaluate project ROI by combining project activity, code contribution and team investment time to provide data support for resource allocation and project decisions.
Compliance Audit Data Support
Provide complete code change history and contributor tracking records for enterprise code audits, intellectual property protection and compliance checks.
Skill Development Tracking
Monitor developers' contribution performance in different technology stack projects, identify skill growth trajectories, and guide personal training and career development planning.
R&D Efficiency Measurement System
Build a data-driven R&D efficiency evaluation framework covering key performance indicators such as development speed, delivery quality, and response time.
Core Features
Project Data Collection
Automatically collect GitLab projects, commits, merge requests and user data, providing comprehensive data analysis foundation.
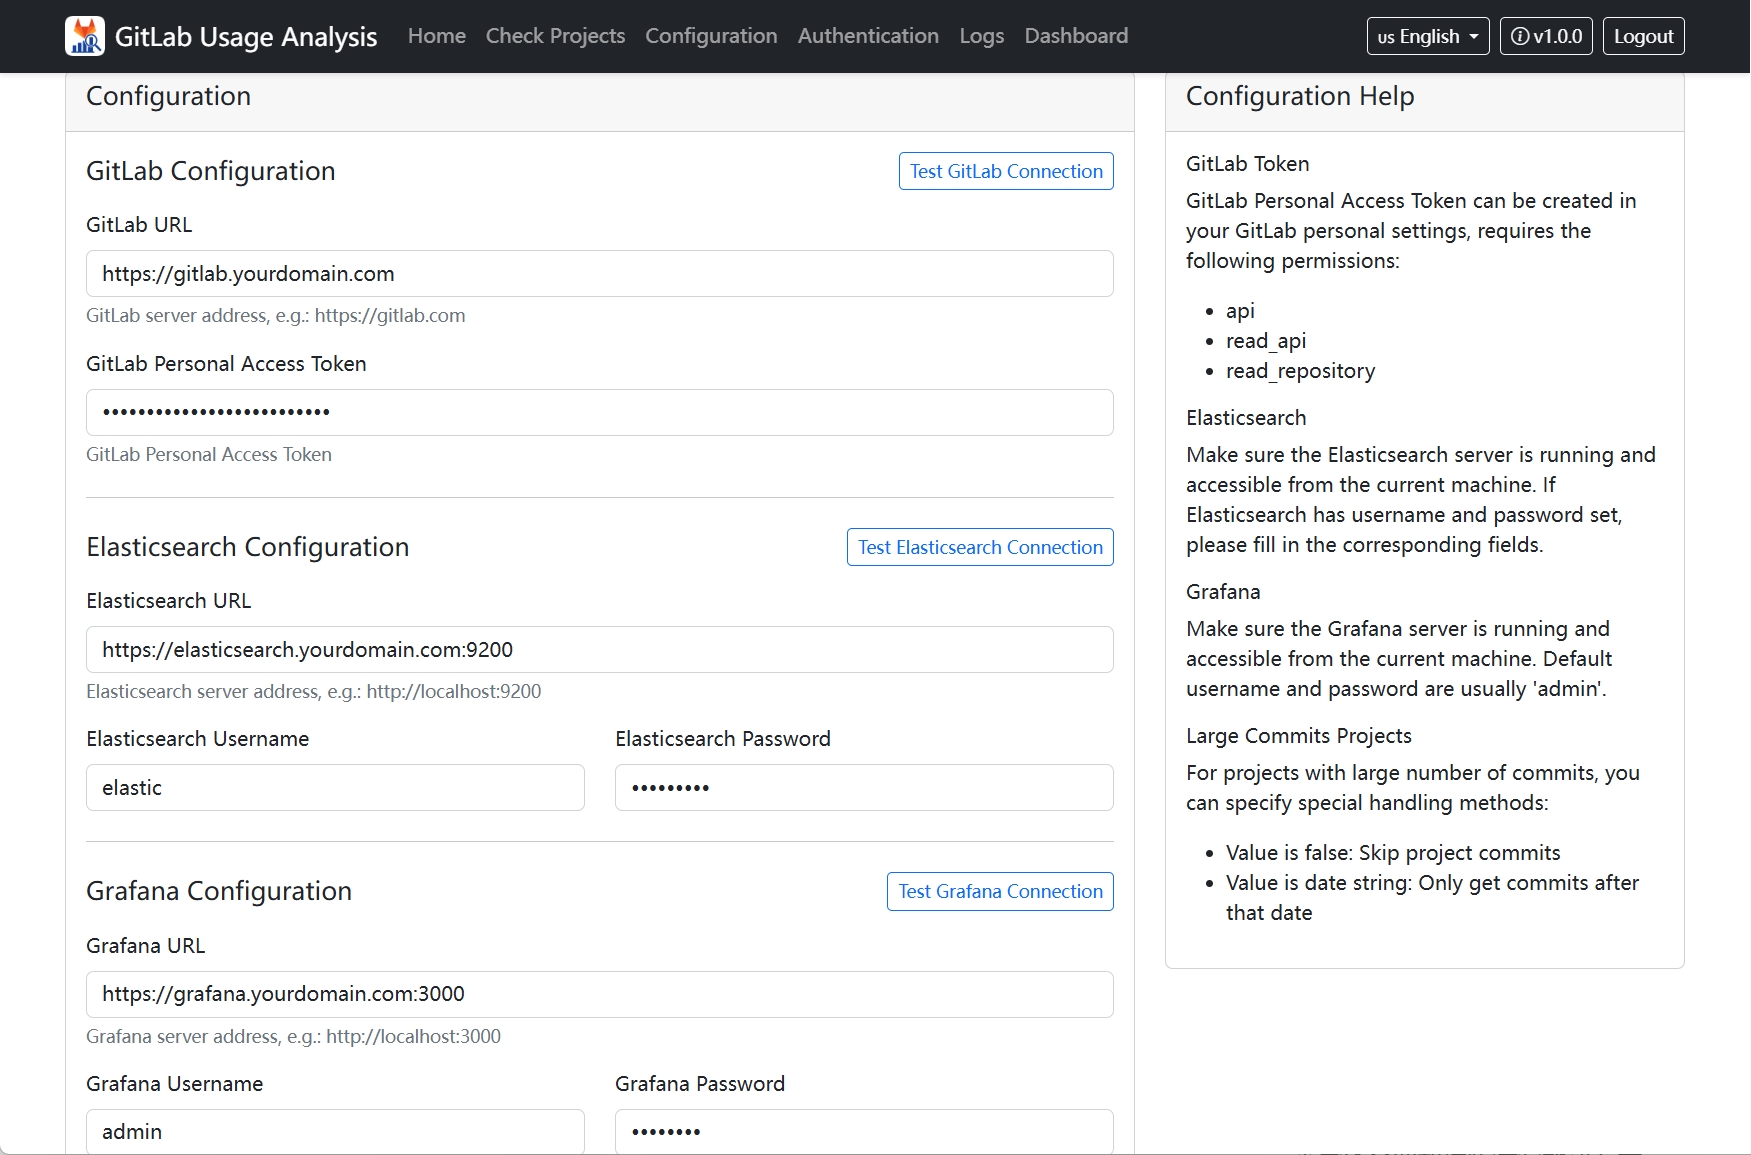
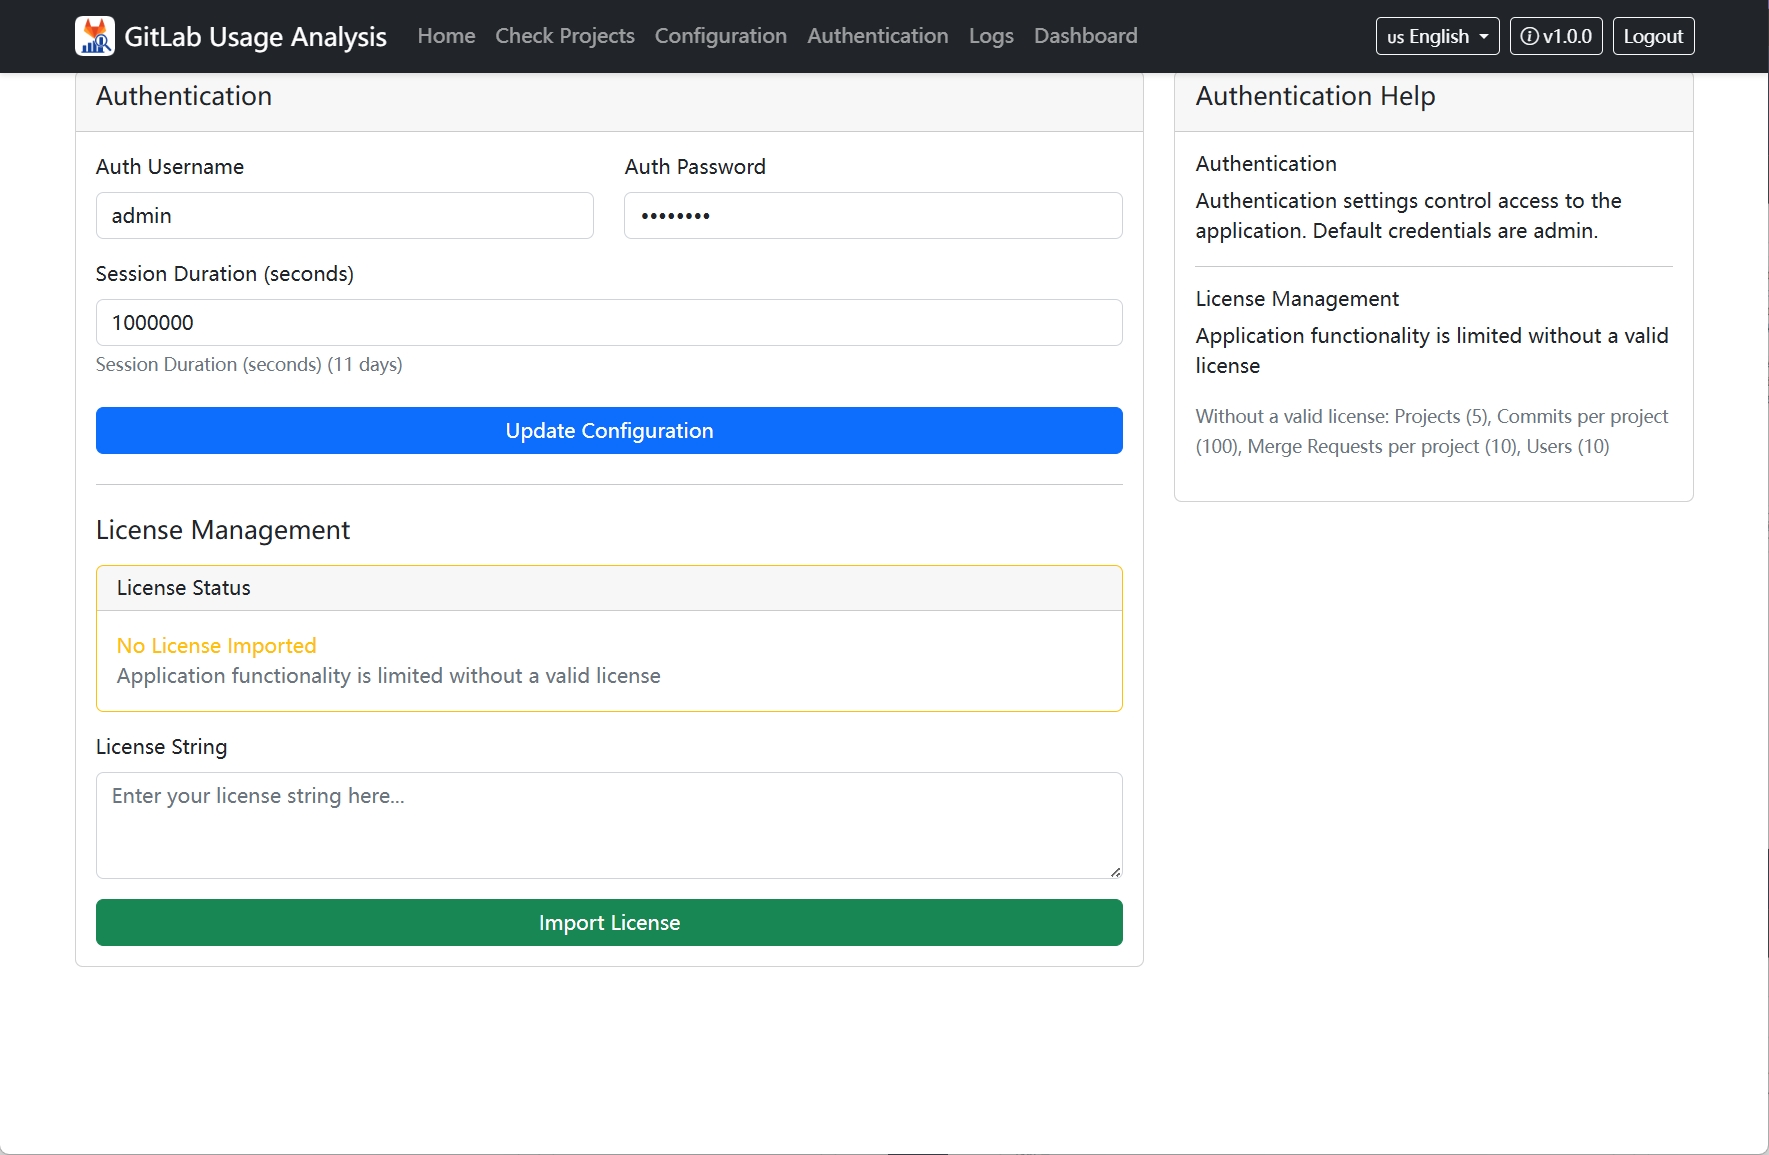
License Management
Support license verification and usage restriction management, providing flexible access control mechanisms.
Multi-language Support
Provides Chinese, English, Japanese, Korean interfaces to meet different users' language needs.
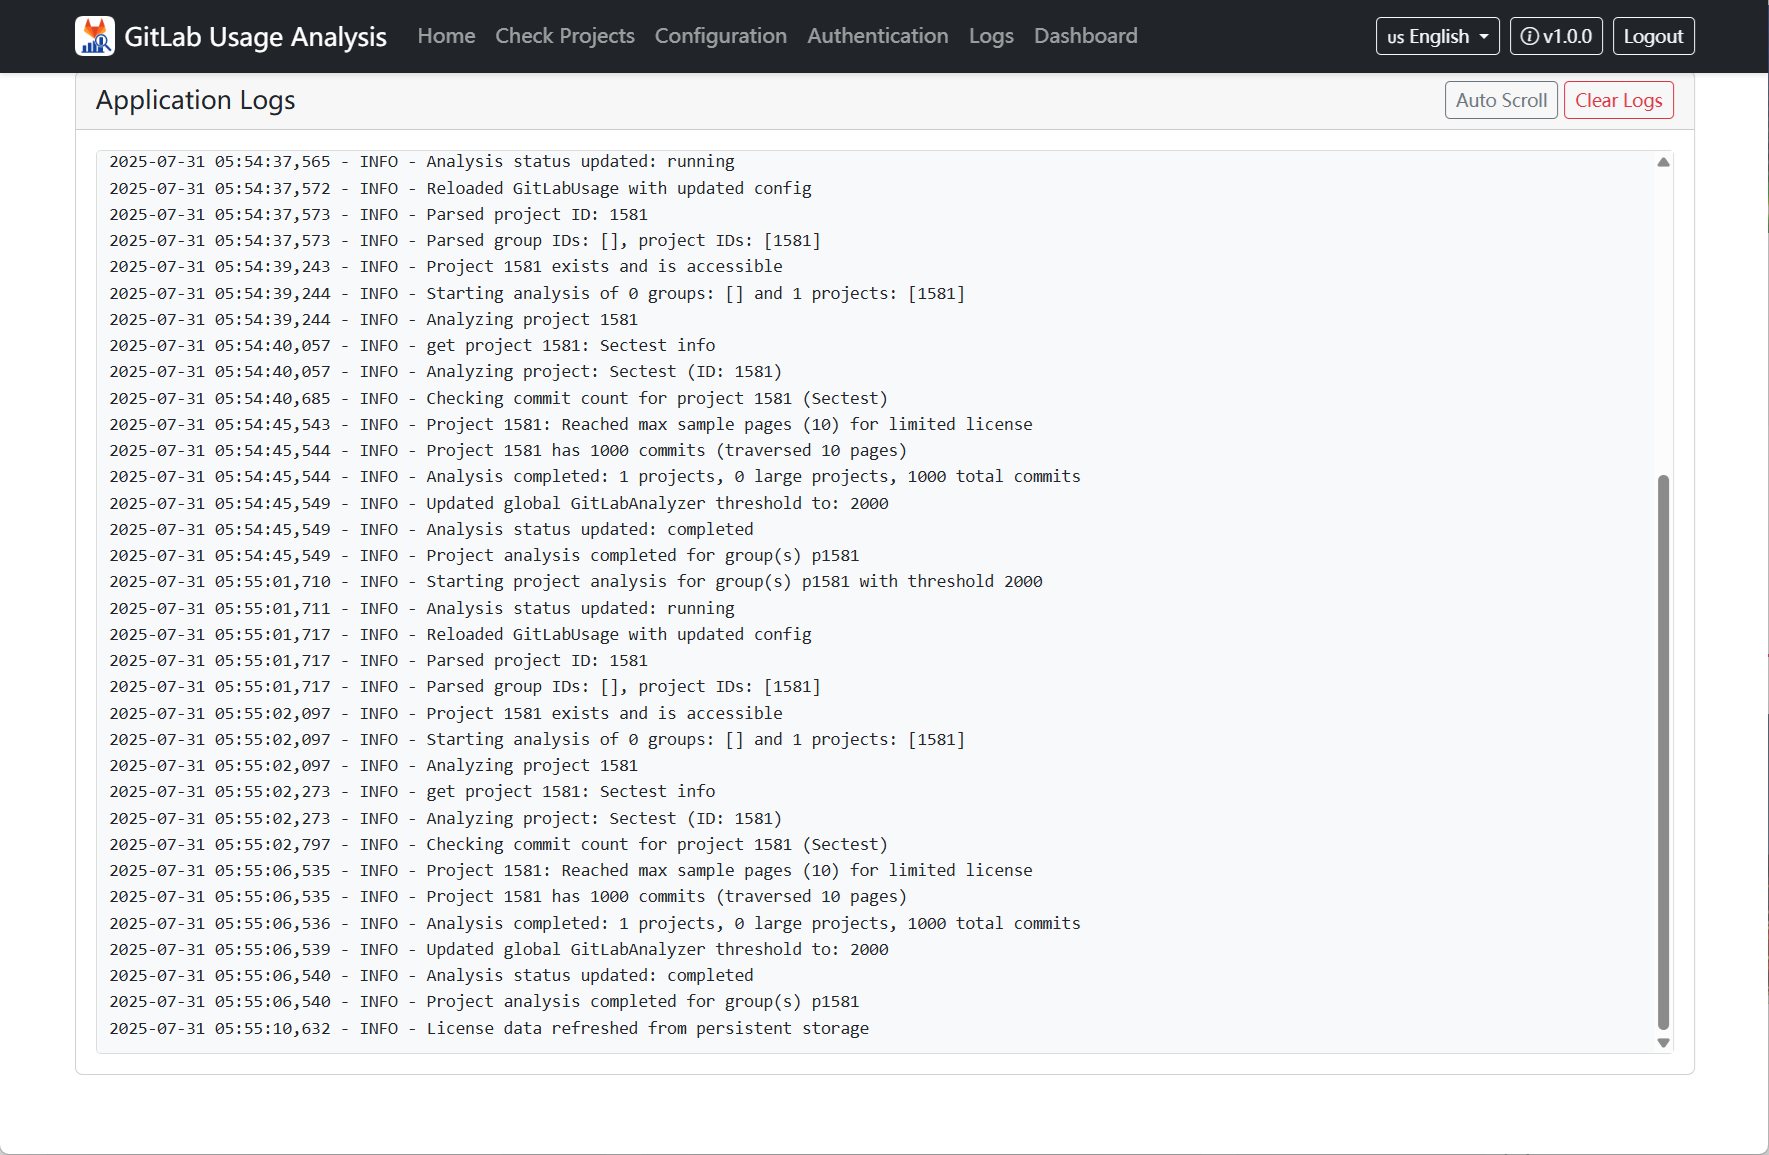
Real-time Monitoring
Real-time monitoring of GitLab activities, timely discovery of project dynamics and anomalies.
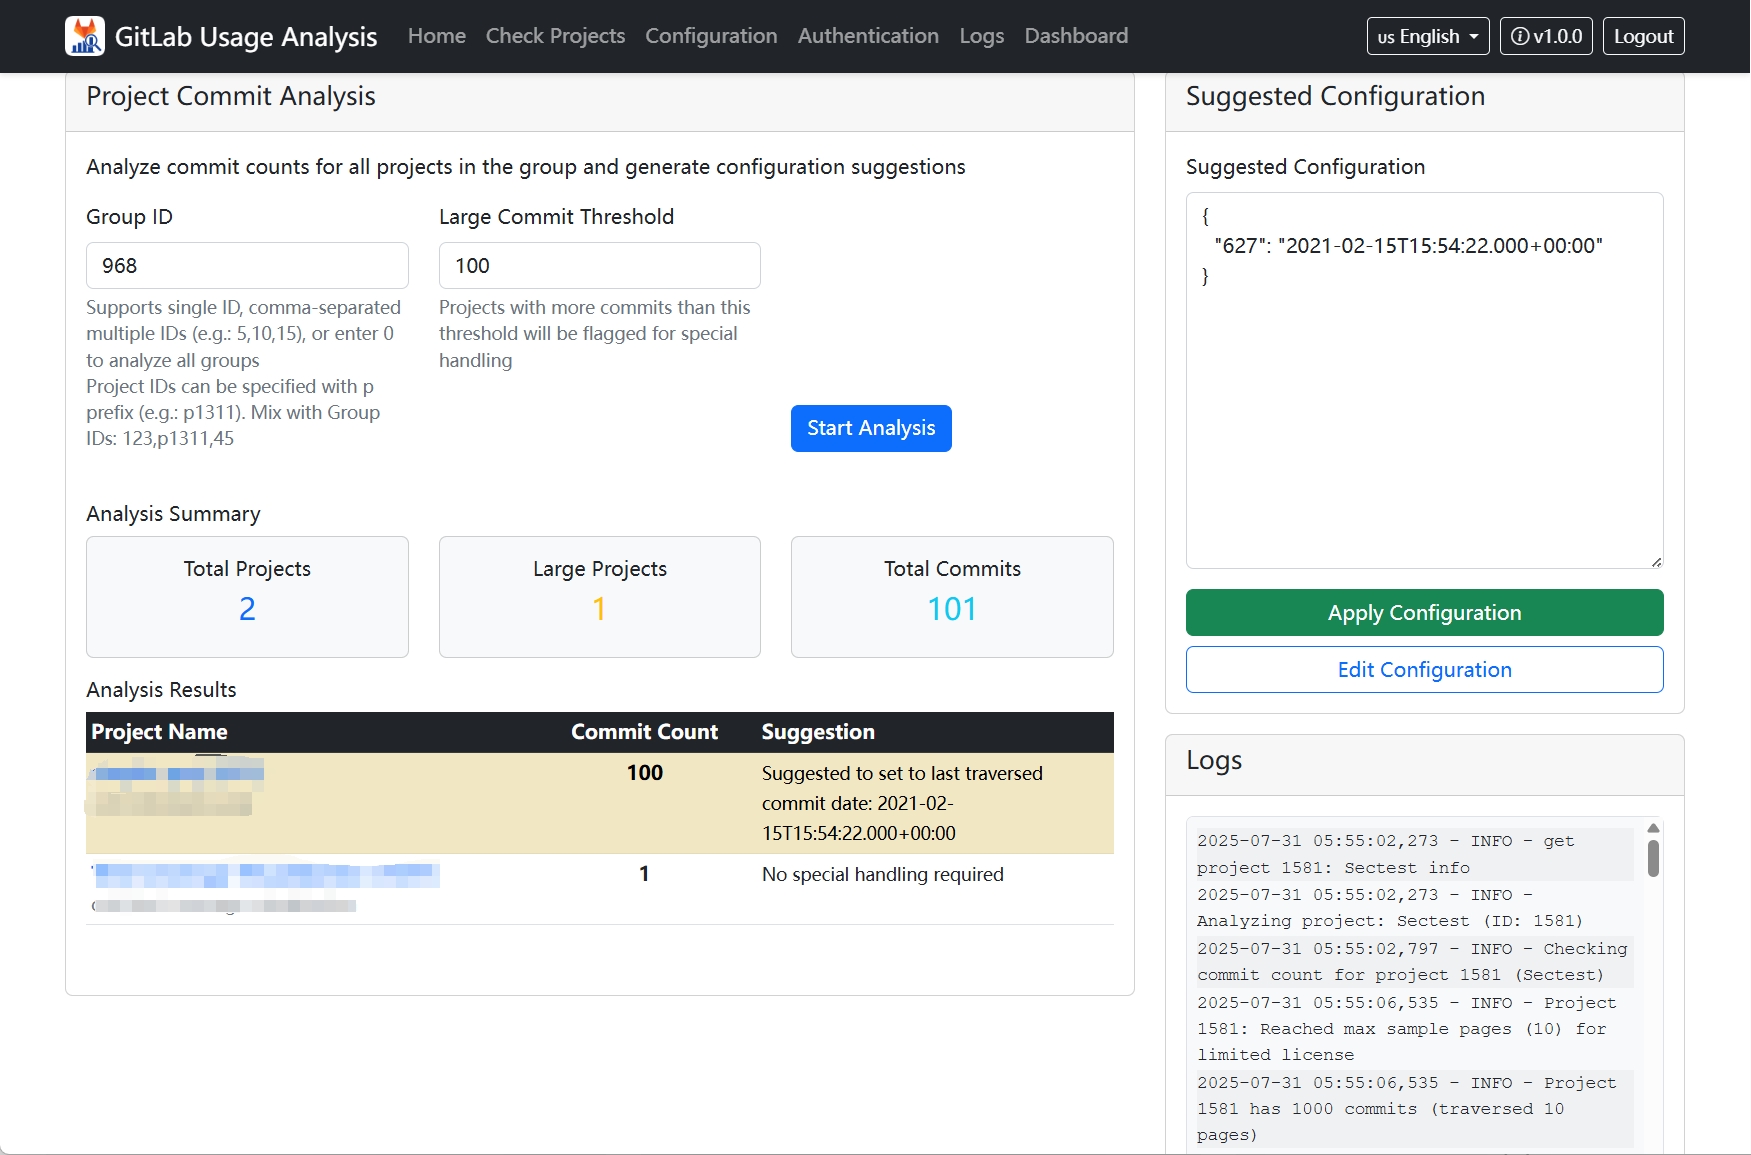
Comprehensive Data Analysis
Provides project inspection functionality supporting multi-dimensional filtering by committer, lines changed, etc., deeply analyzing large commit counts to optimize project performance and development efficiency.
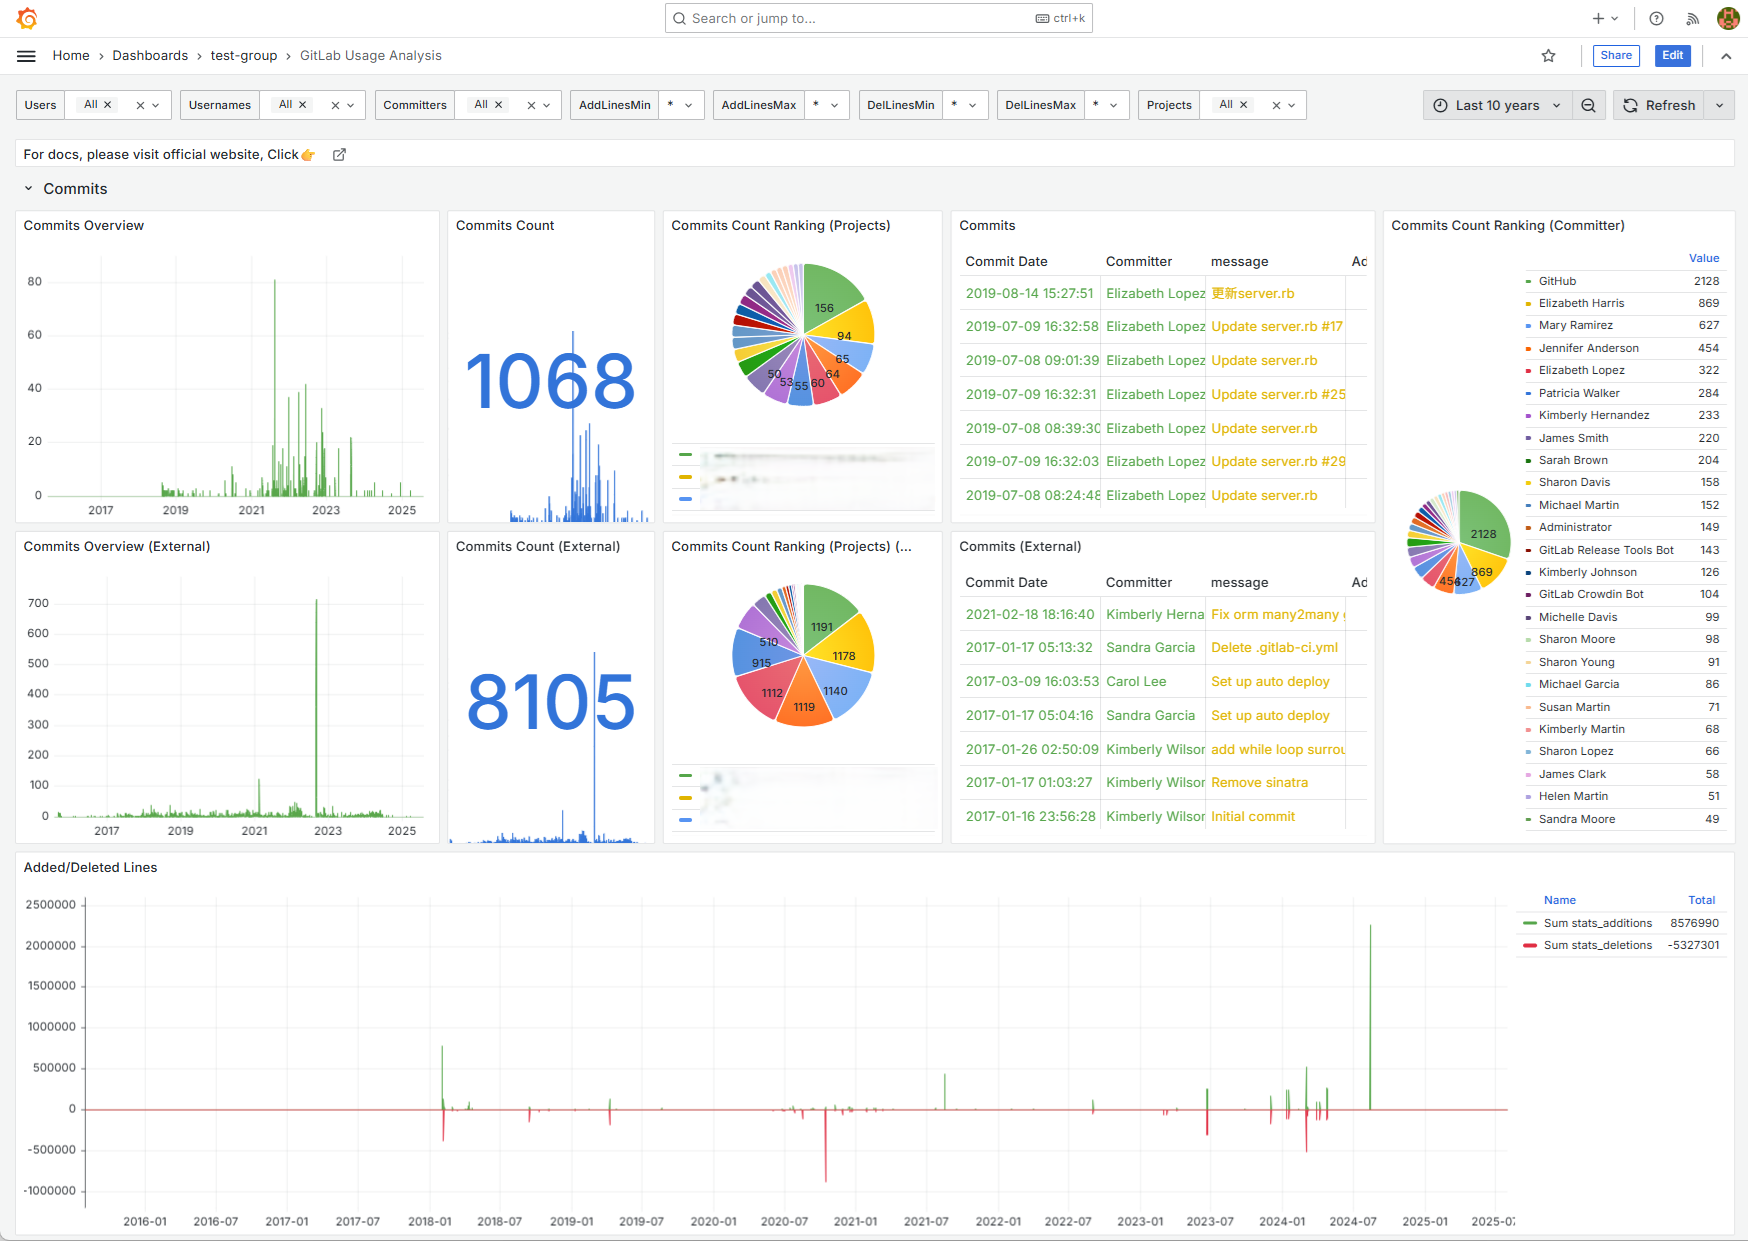
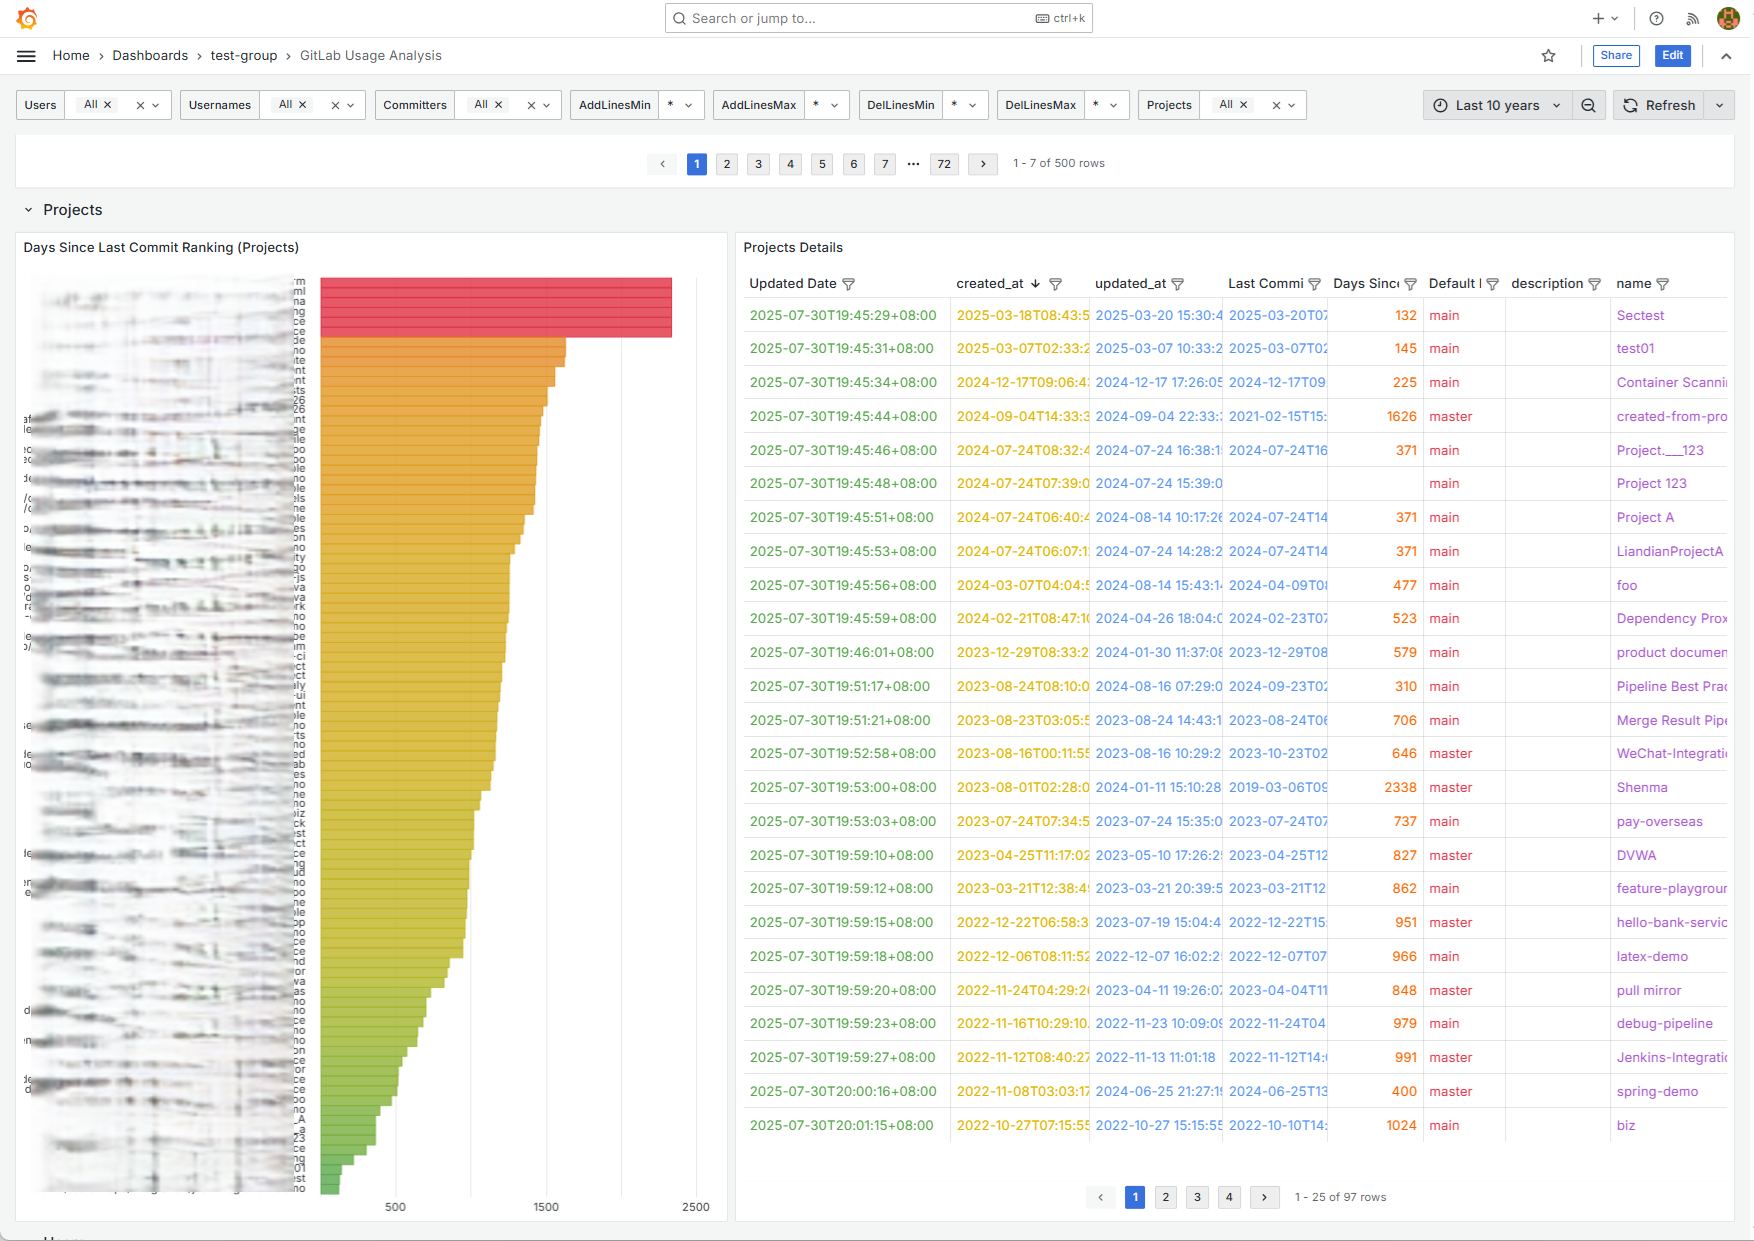
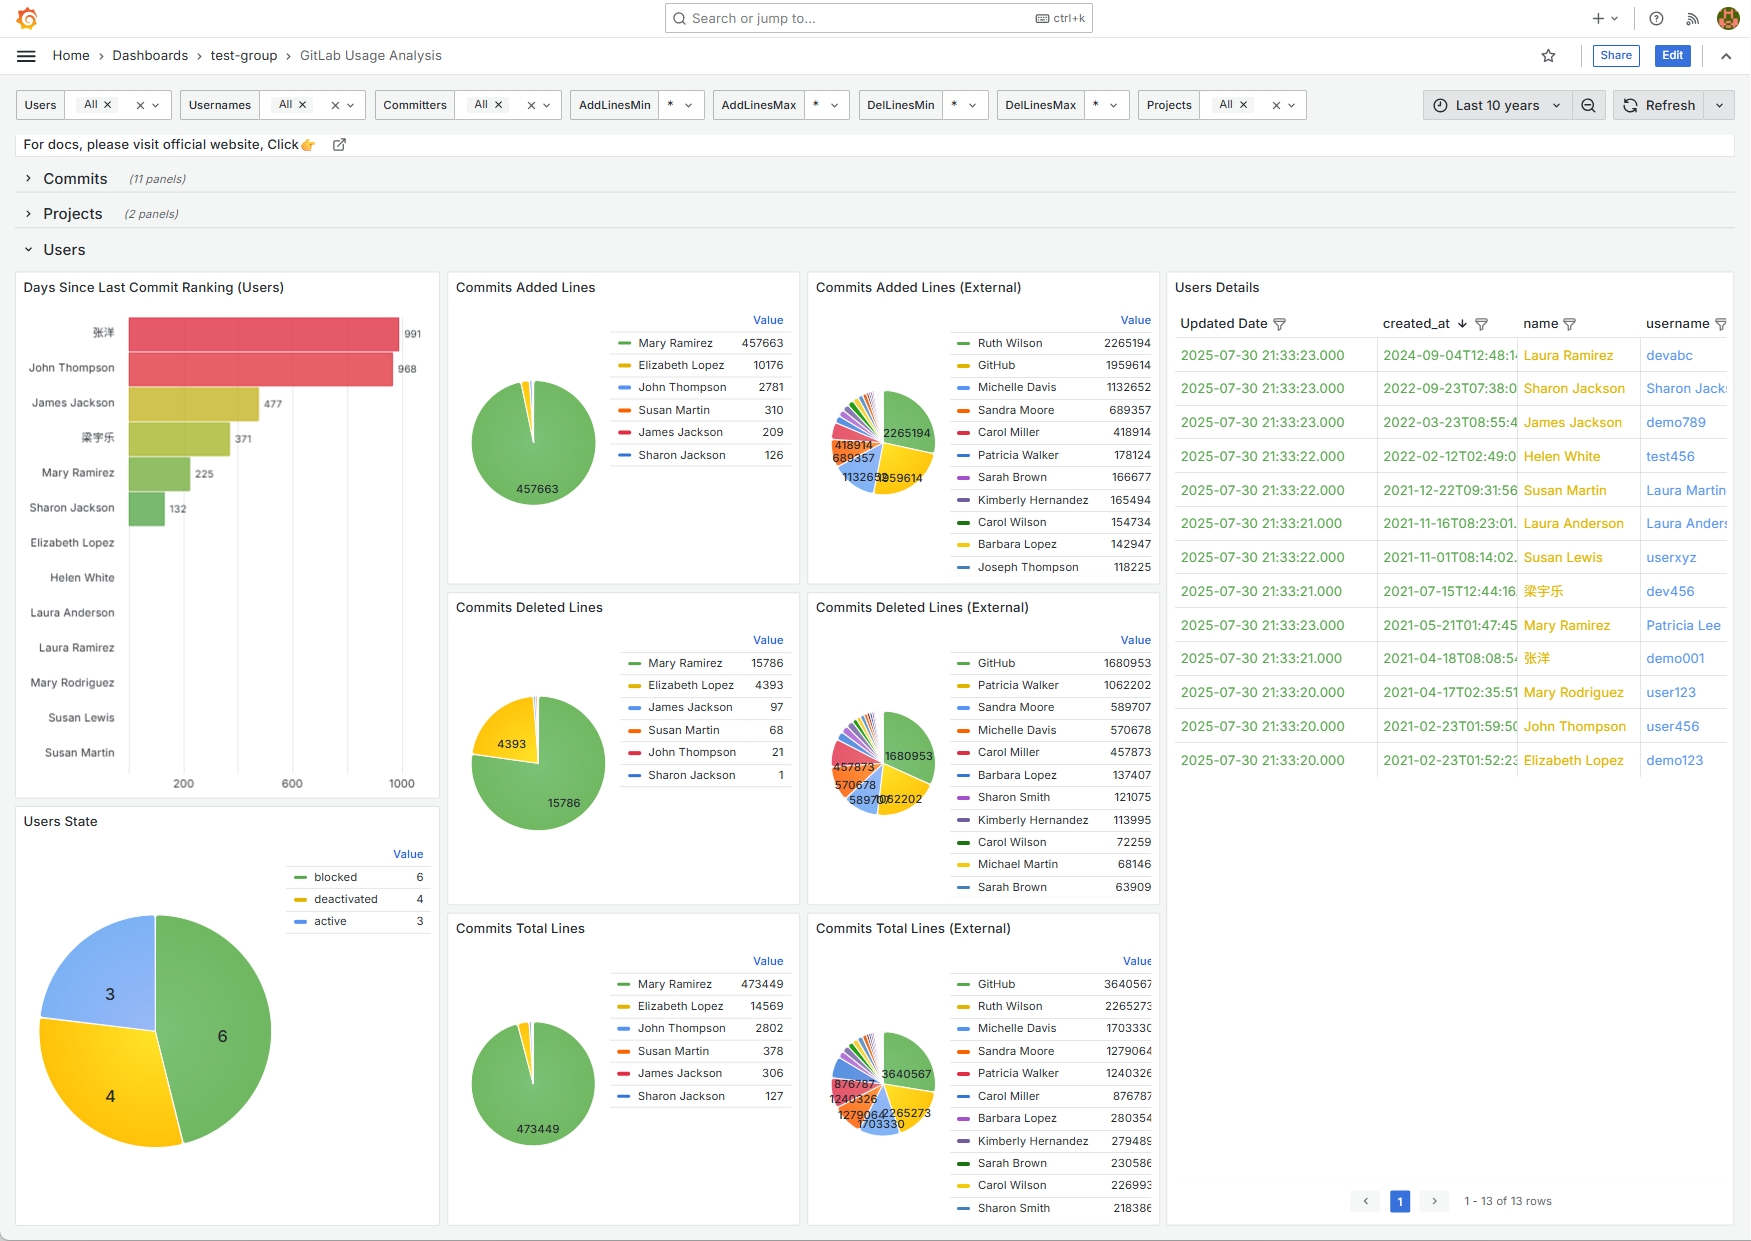
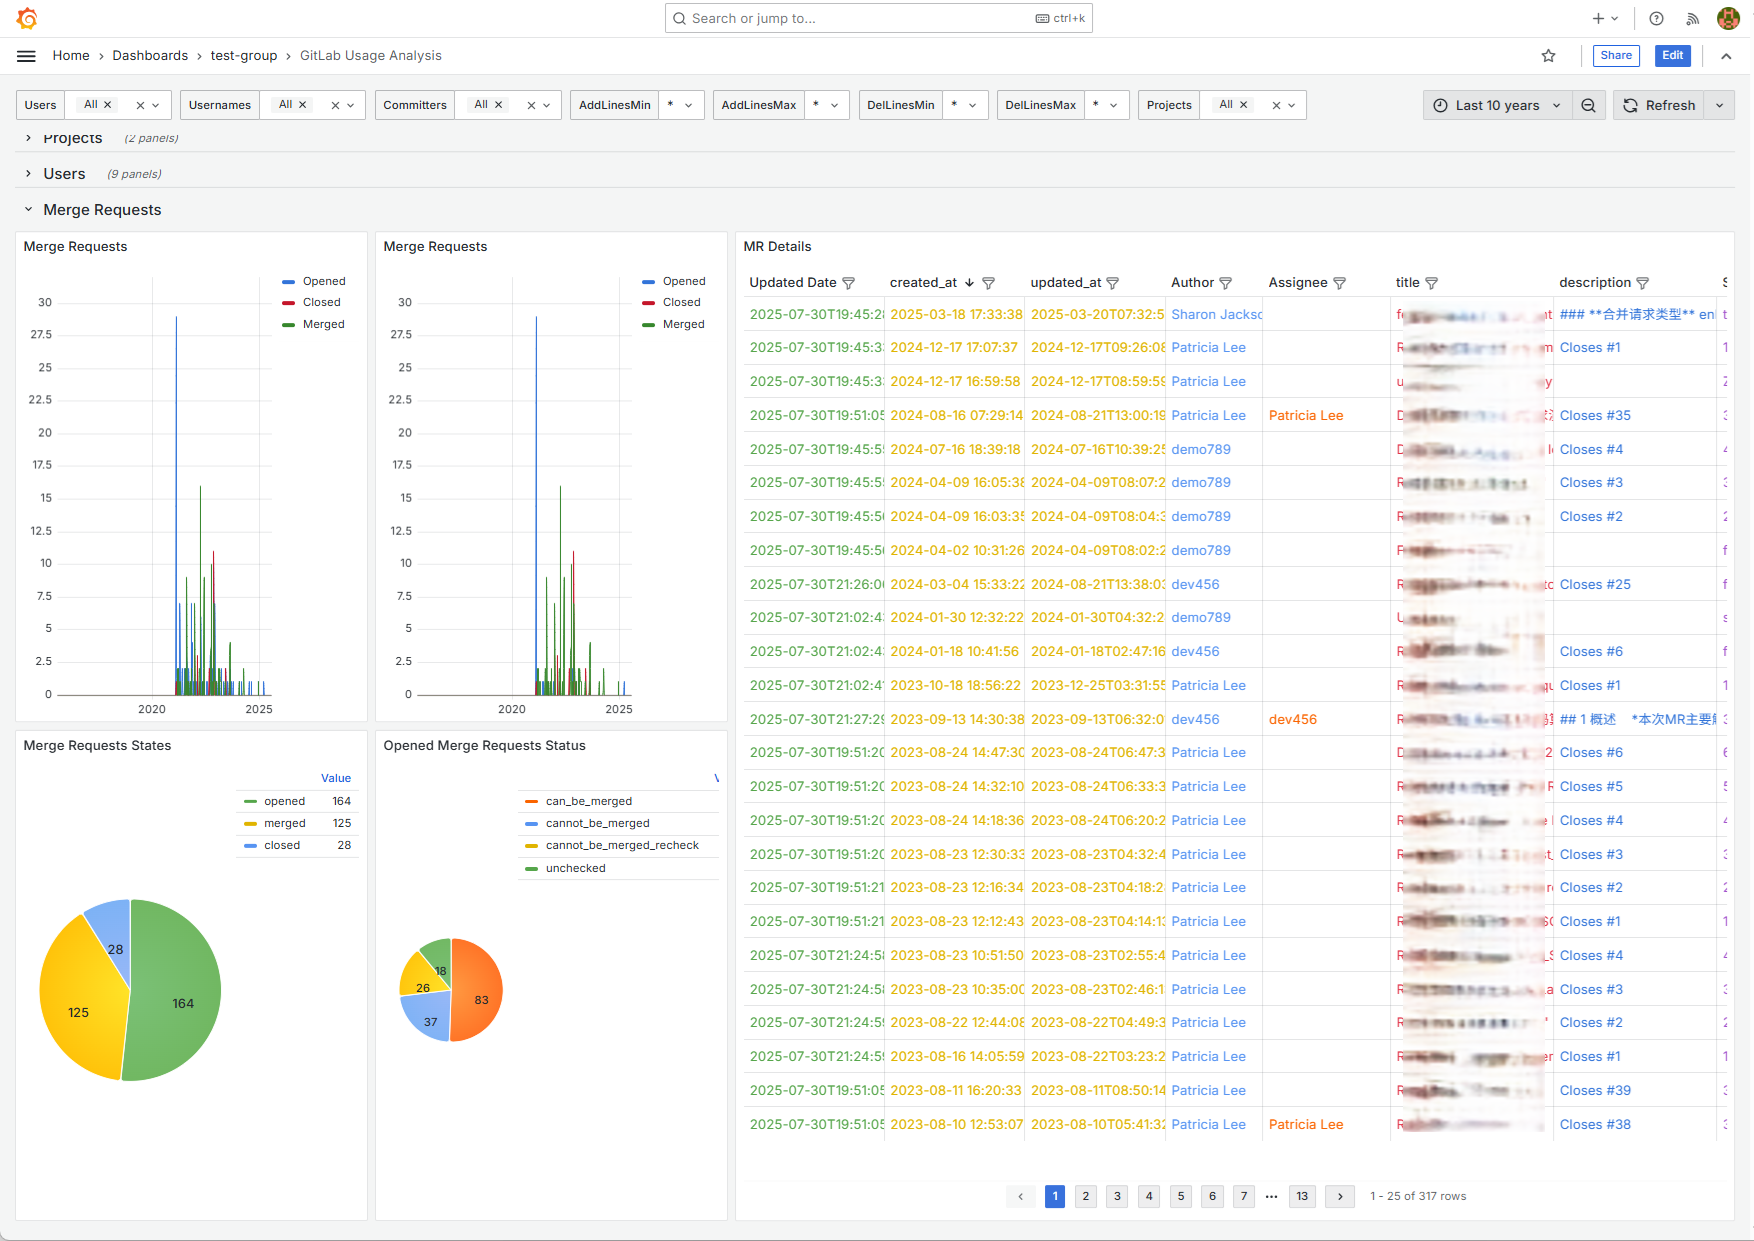
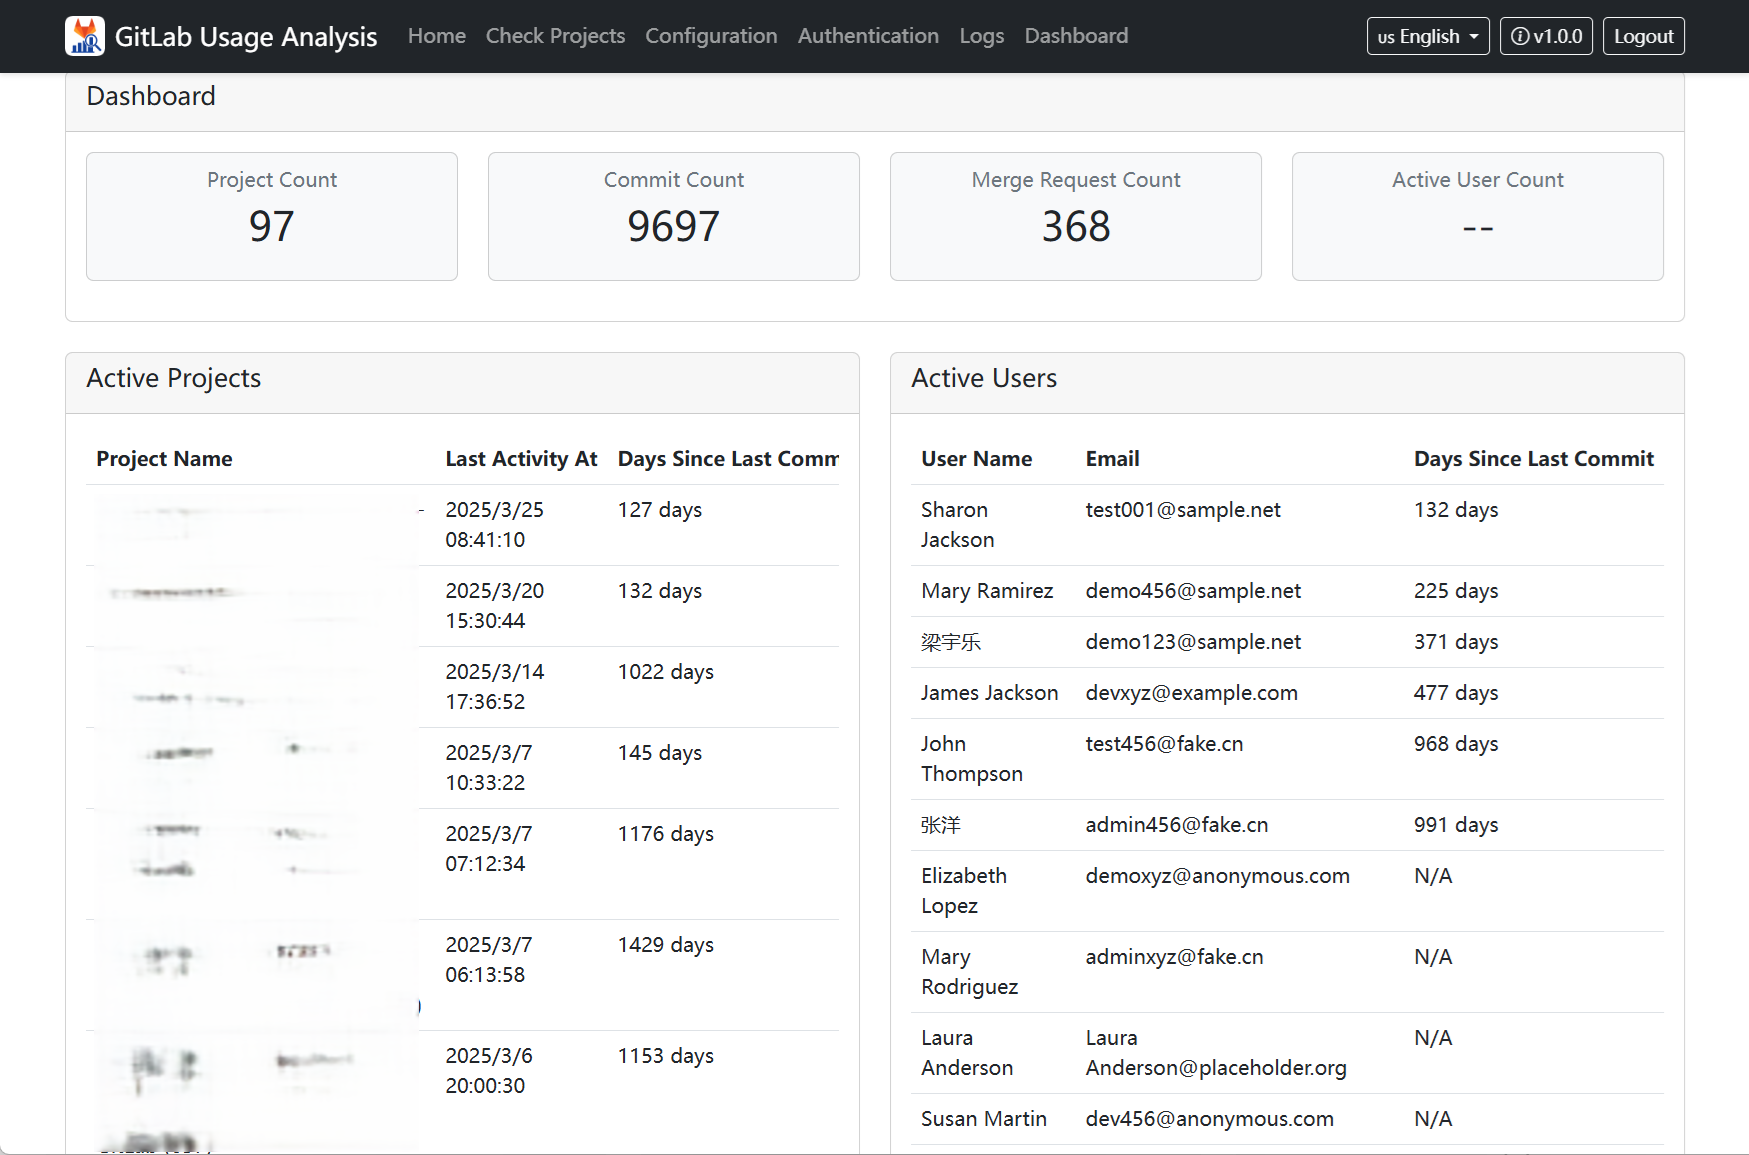
Rich Dashboard Display
Includes Grafana visualization effects for four core modules: Commits, Projects, Users, Merge Requests, intuitively showing development team achievements and project health.
Technical Architecture
Docker
Version 20+
GitLab
Version 16.x
Elasticsearch
Version 8.x
Grafana
Version 11.x
Grafana Dashboard Showcase
Product Interface Showcase
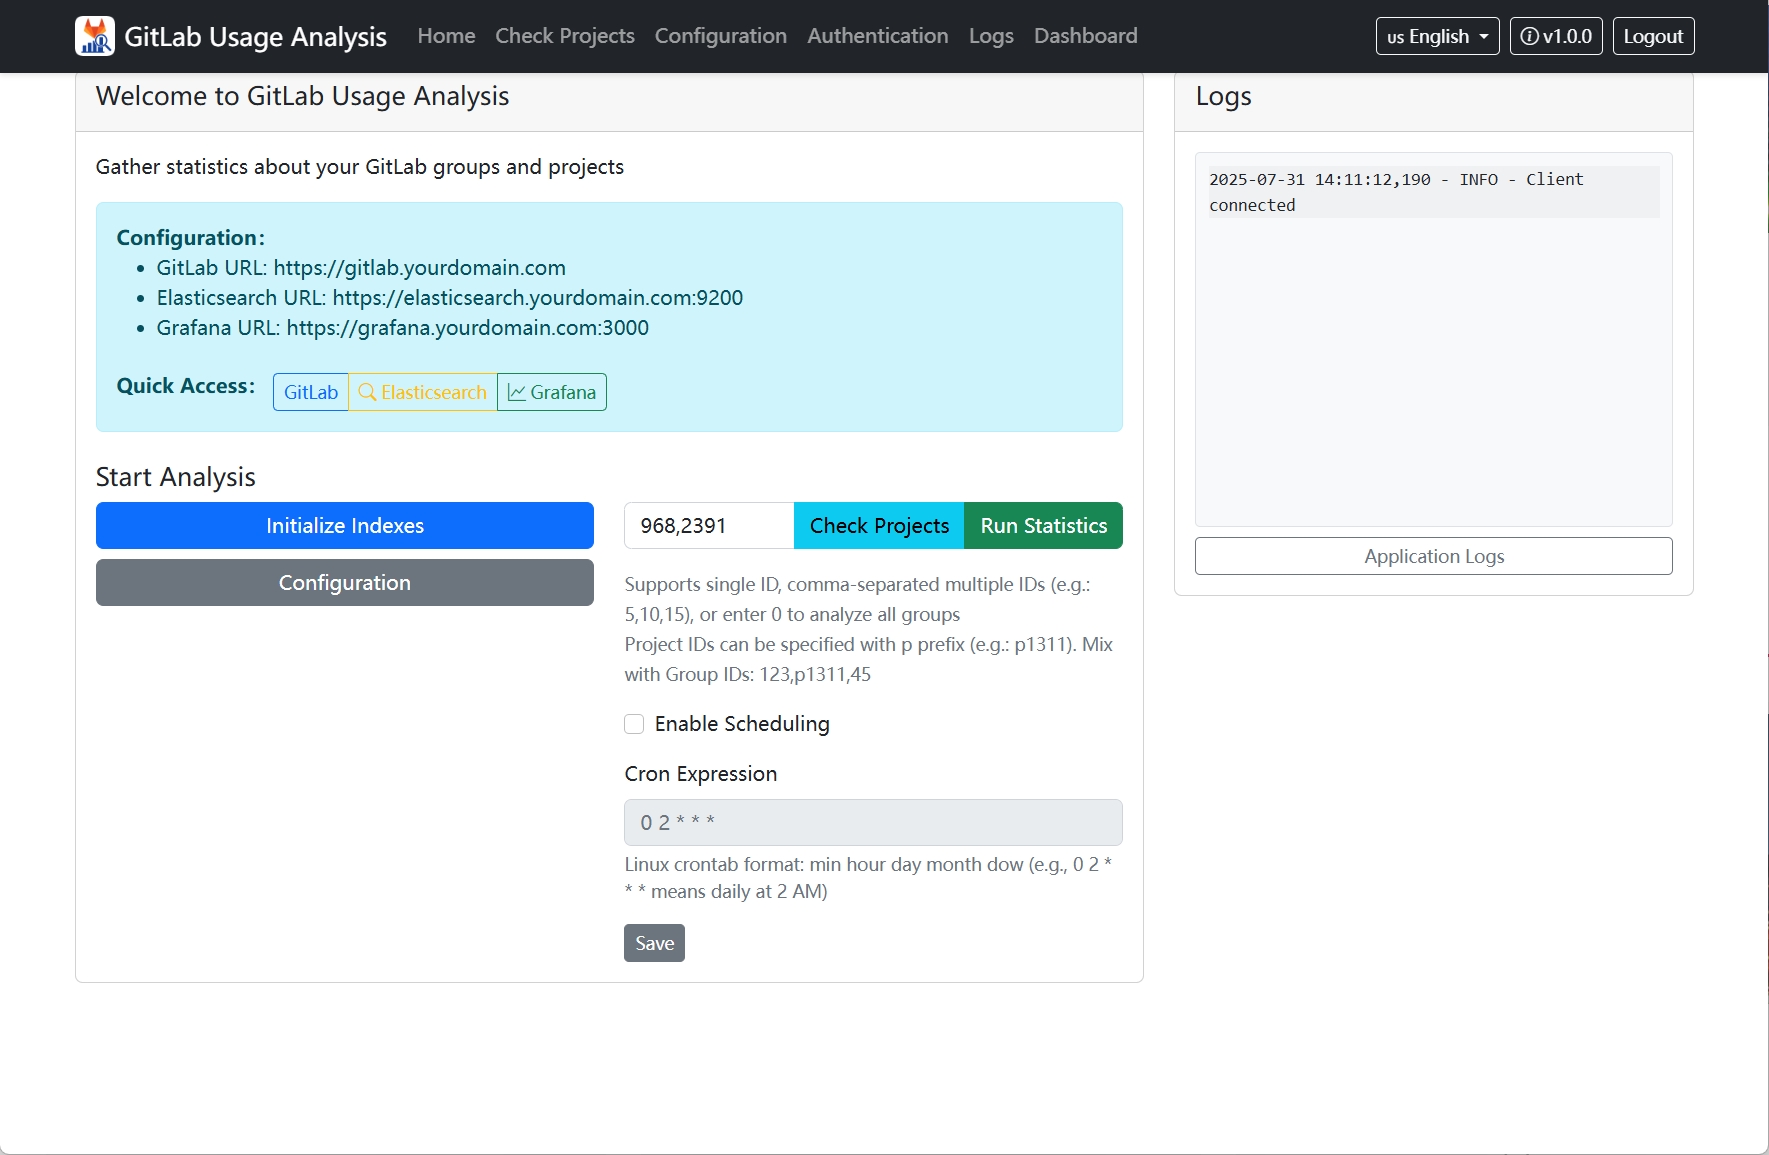
Start Your Data Analysis Journey
Deploy with Docker in one click, start analyzing your GitLab data in minutes