Table of Contents
User Guide
Complete usage guide and deployment instructions for GitLab Usage Analysis
Overview
GitLab Usage Analysis System is a professional GitLab data analysis tool that can collect, analyze and visualize your GitLab project data. Through Elasticsearch storage combined with Grafana dashboards, it provides comprehensive project usage insights.
Analysis Results Showcase
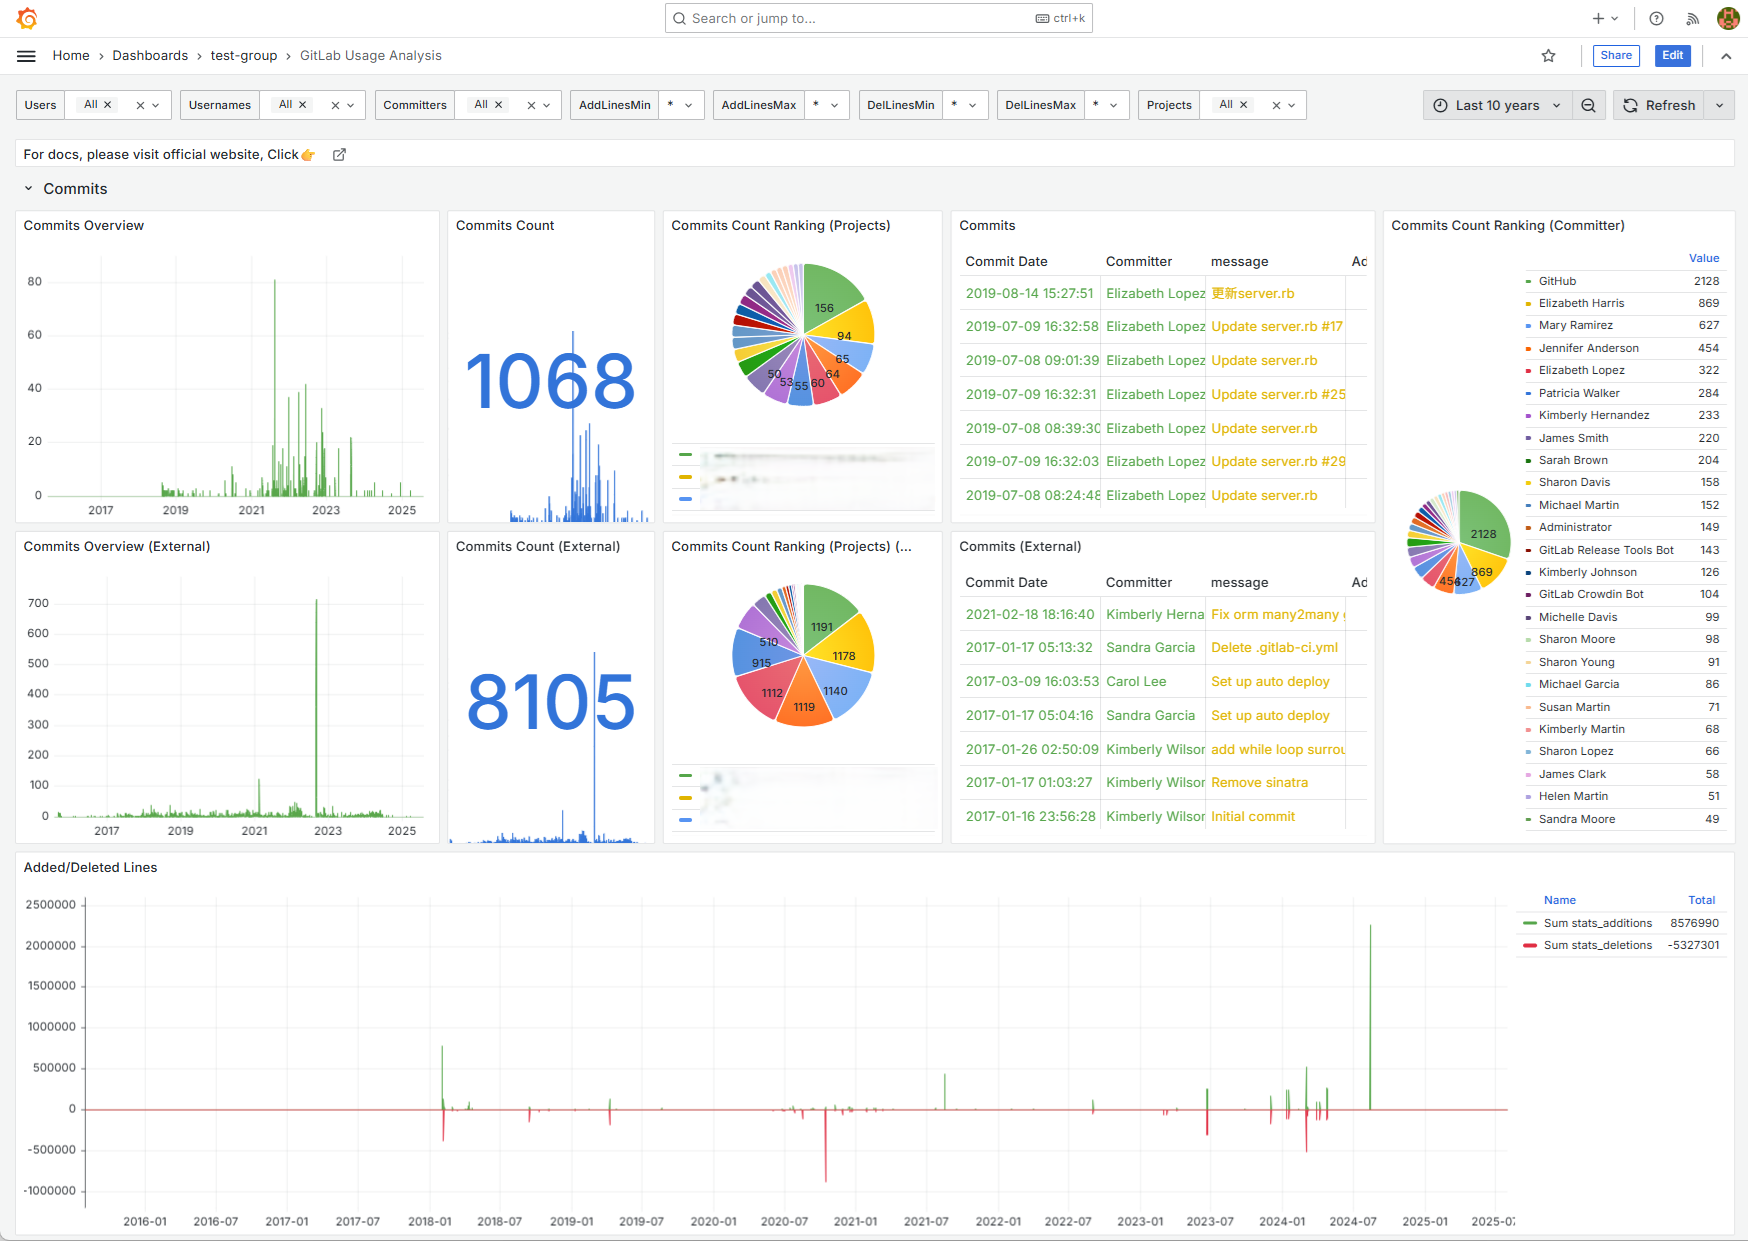
Commits Analysis
Supports multiple filtering conditions, can view from multiple dimensions such as project, committer, lines changed.
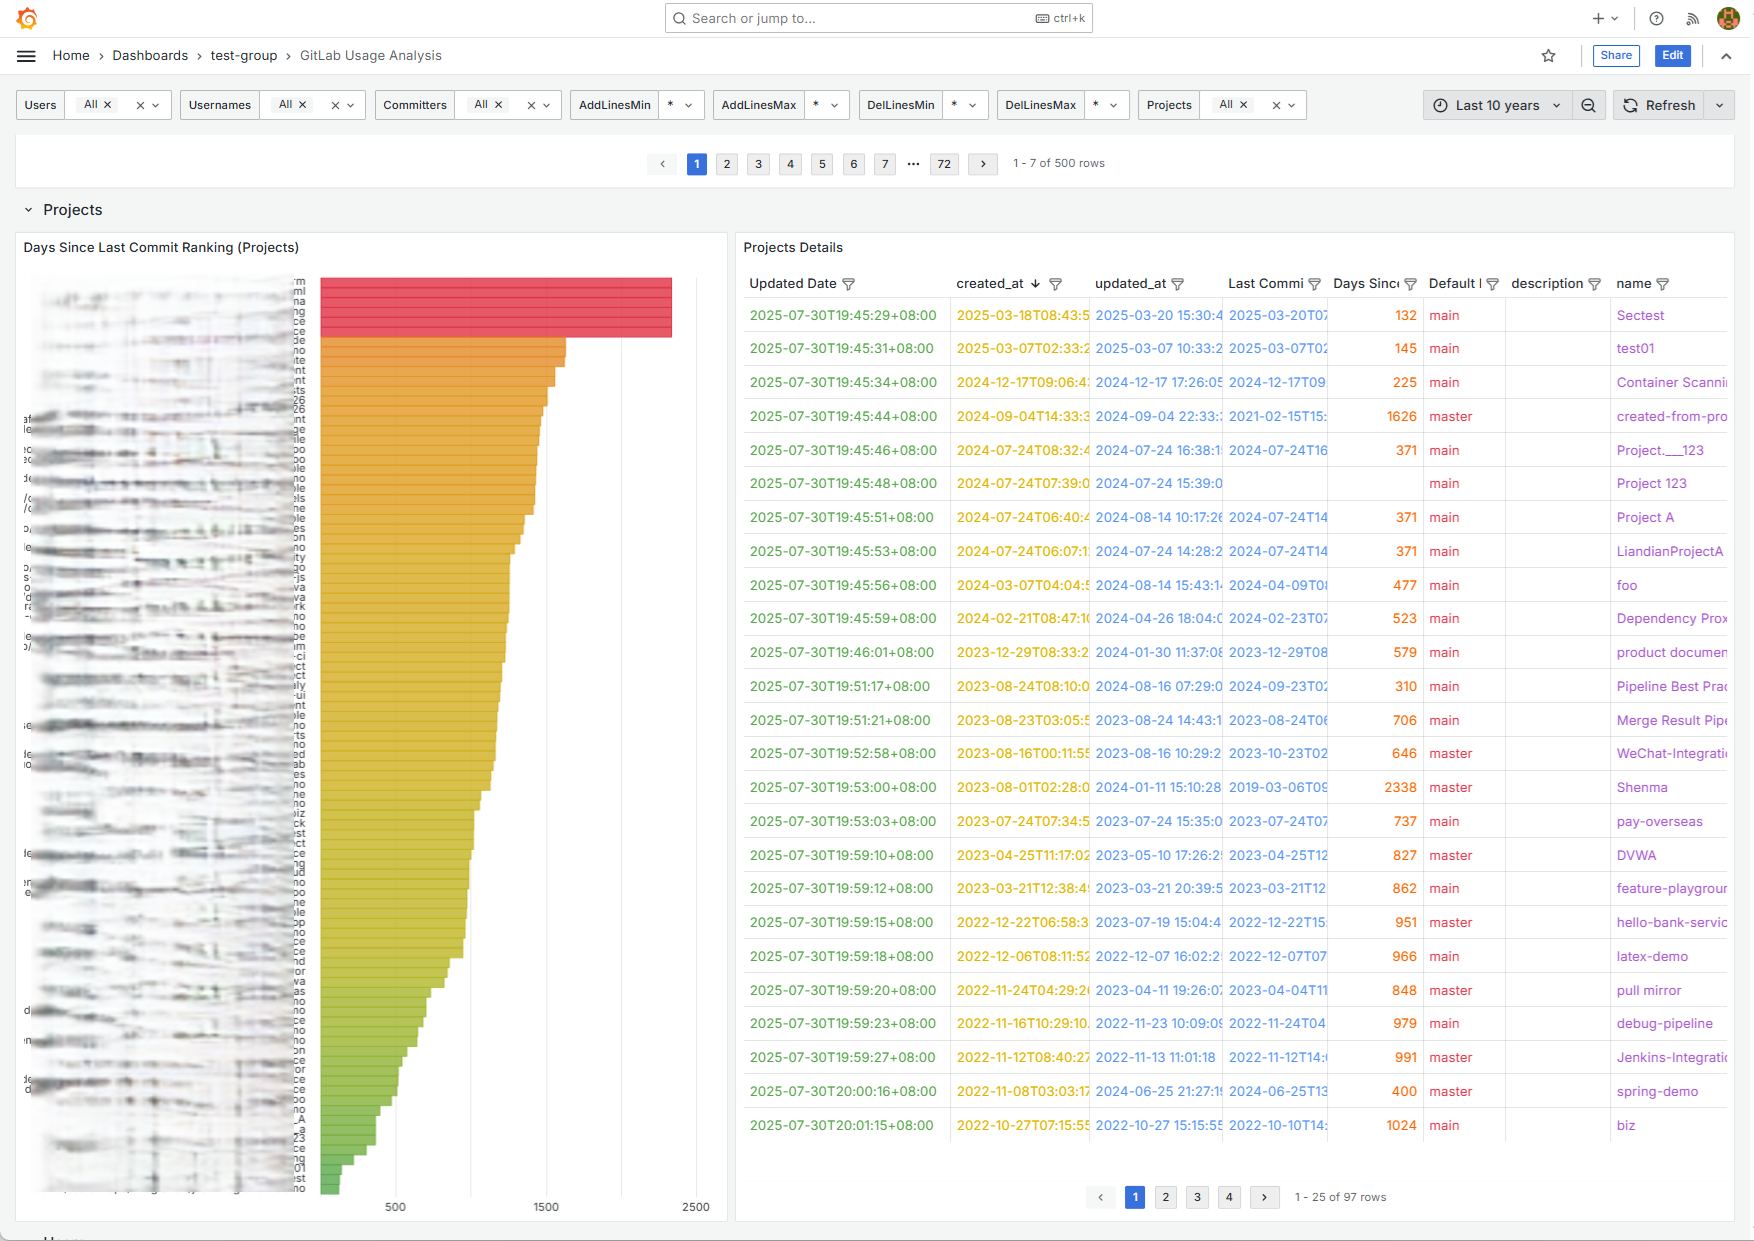
Projects Statistics
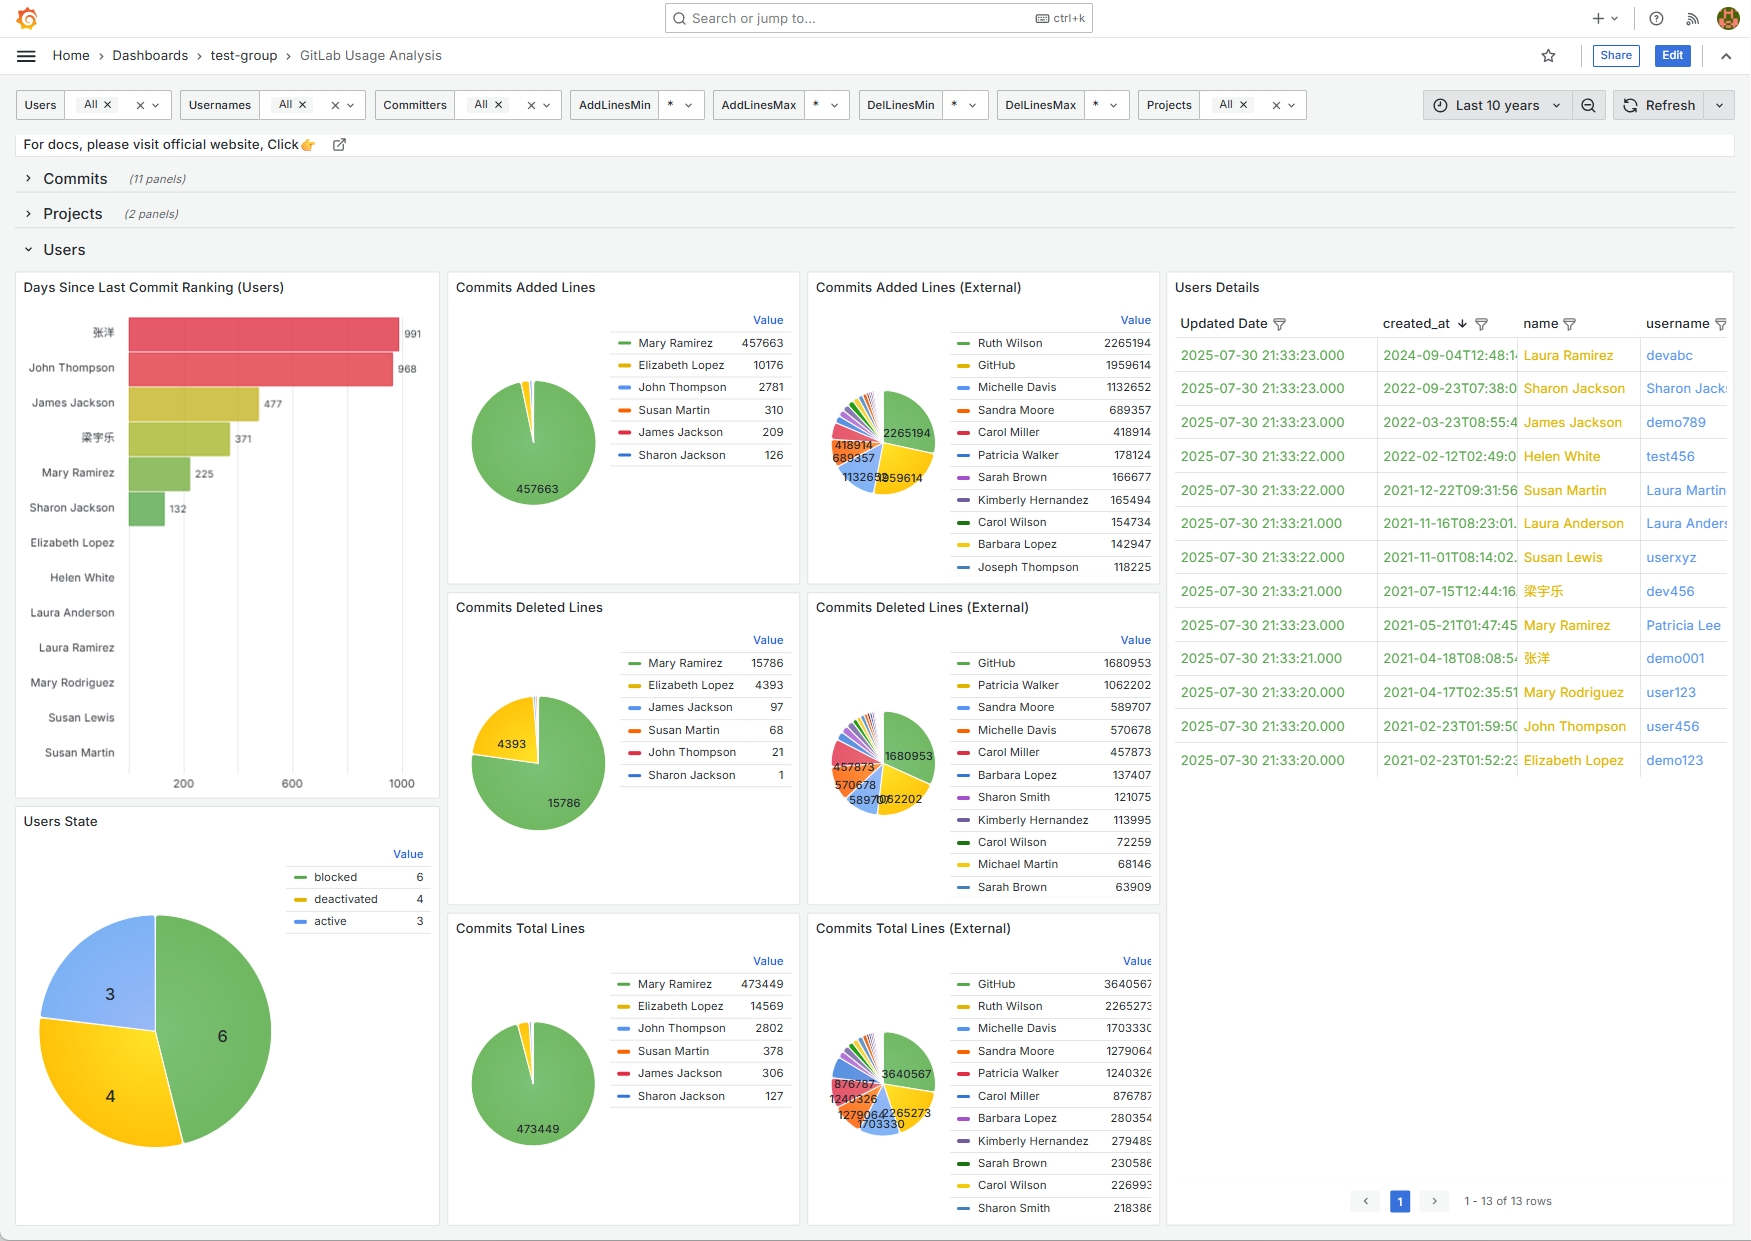
Users Activity
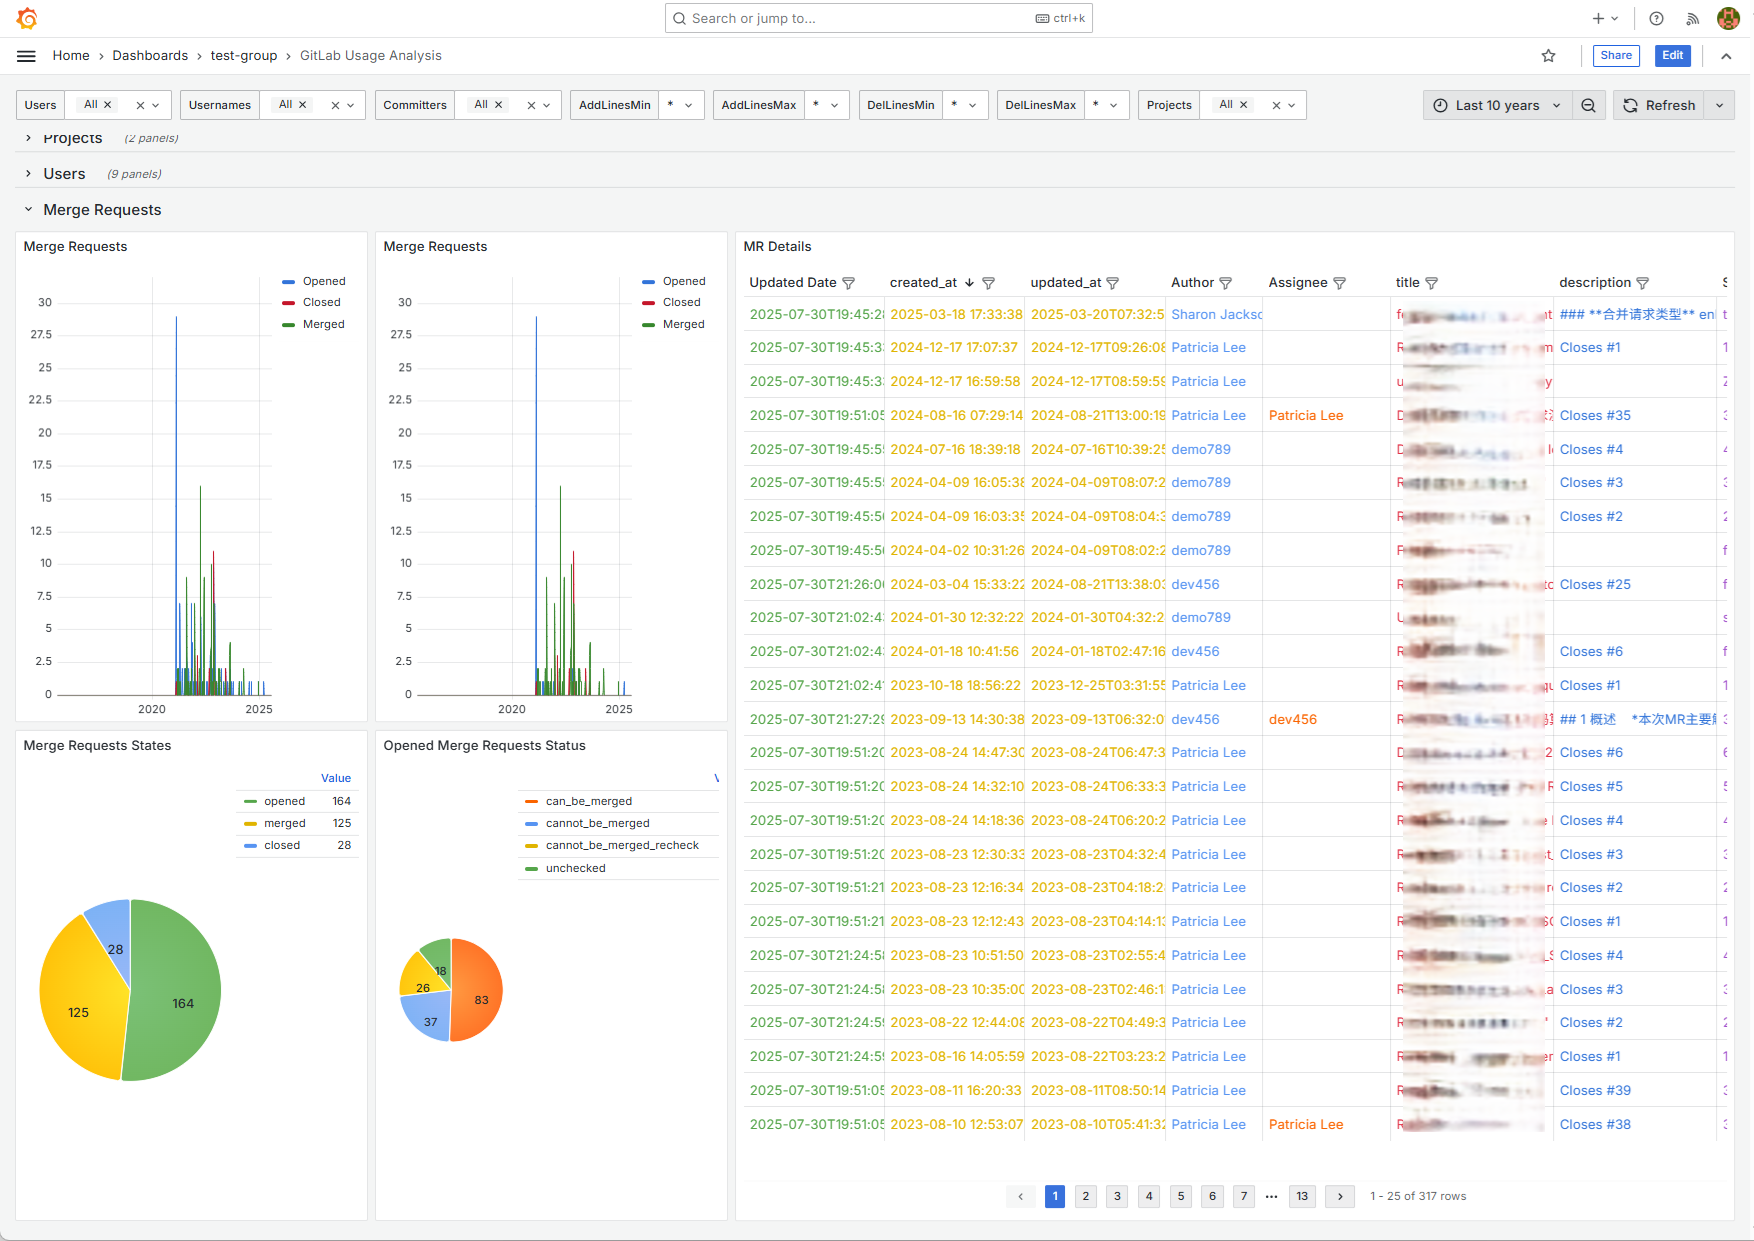
Merge Requests Analysis
System Requirements
Minimum Configuration Requirements
- Operating System: Docker-supported OS (Windows 10+, macOS 10.14+, Ubuntu 18.04+ or other Linux distributions)
- Memory: 4GB RAM (8GB or more recommended)
- Disk Space: At least 10GB available space
- Network: Need access to GitLab and Elasticsearch cluster and Grafana instance
Dependencies
- Docker: Version 20+
- GitLab: Version 16.x
- Elasticsearch: Version 8.x
- Grafana: Version 11.x
Deployment and Configuration
1Prepare Configuration File
- 创建
config.yaml配置文件 - 编辑配置文件,设置以下关键参数:
# Login user configuration (required)
AUTH_USERNAME: admin
AUTH_PASSWORD: admin
AUTH_COOKIE_DURATION: 1000000

# GitLab configuration (can be configured later via UI)
GITLAB_URL: https://your-gitlab-instance.com
GITLAB_PAT: your-gitlab-access-token

# Elasticsearch configuration (can be configured later via UI)
ELASTICSEARCH_URL: http://your-elasticsearch:9200
ELASTICSEARCH_USER: es-username # if authentication required
ELASTICSEARCH_PASSWORD: es-password # if authentication required

# Grafana configuration (can be configured later via UI)
GRAFANA_URL: http://your-grafana:3000
GRAFANA_USERNAME: gf-username
GRAFANA_PASSWORD: gf-password
创建 config.yaml 完成后,为确保容器内用户可以操作文件,可以对其设置为任何用户可读写:
chmod 666 config.yaml2Deploy with Docker
使用以下命令启动系统:
# Start new container
docker run -itd --name gua \
  -p 8081:8081 \
  -v /path/to/your/config.yaml:/srv/config.yaml \
  rourin/gitlab-usage-analysis:1.0.0

# View logs
docker logs -f gua
注意事项
- 将
/path/to/your/config.yaml替换为您实际的配置文件路径 - 系统将在端口
8081上运行,可以自行修改映射其他主机端口
3First Access
- 启动后,在浏览器中访问
http://localhost:8081 - 系统将引导您完成初始化设置
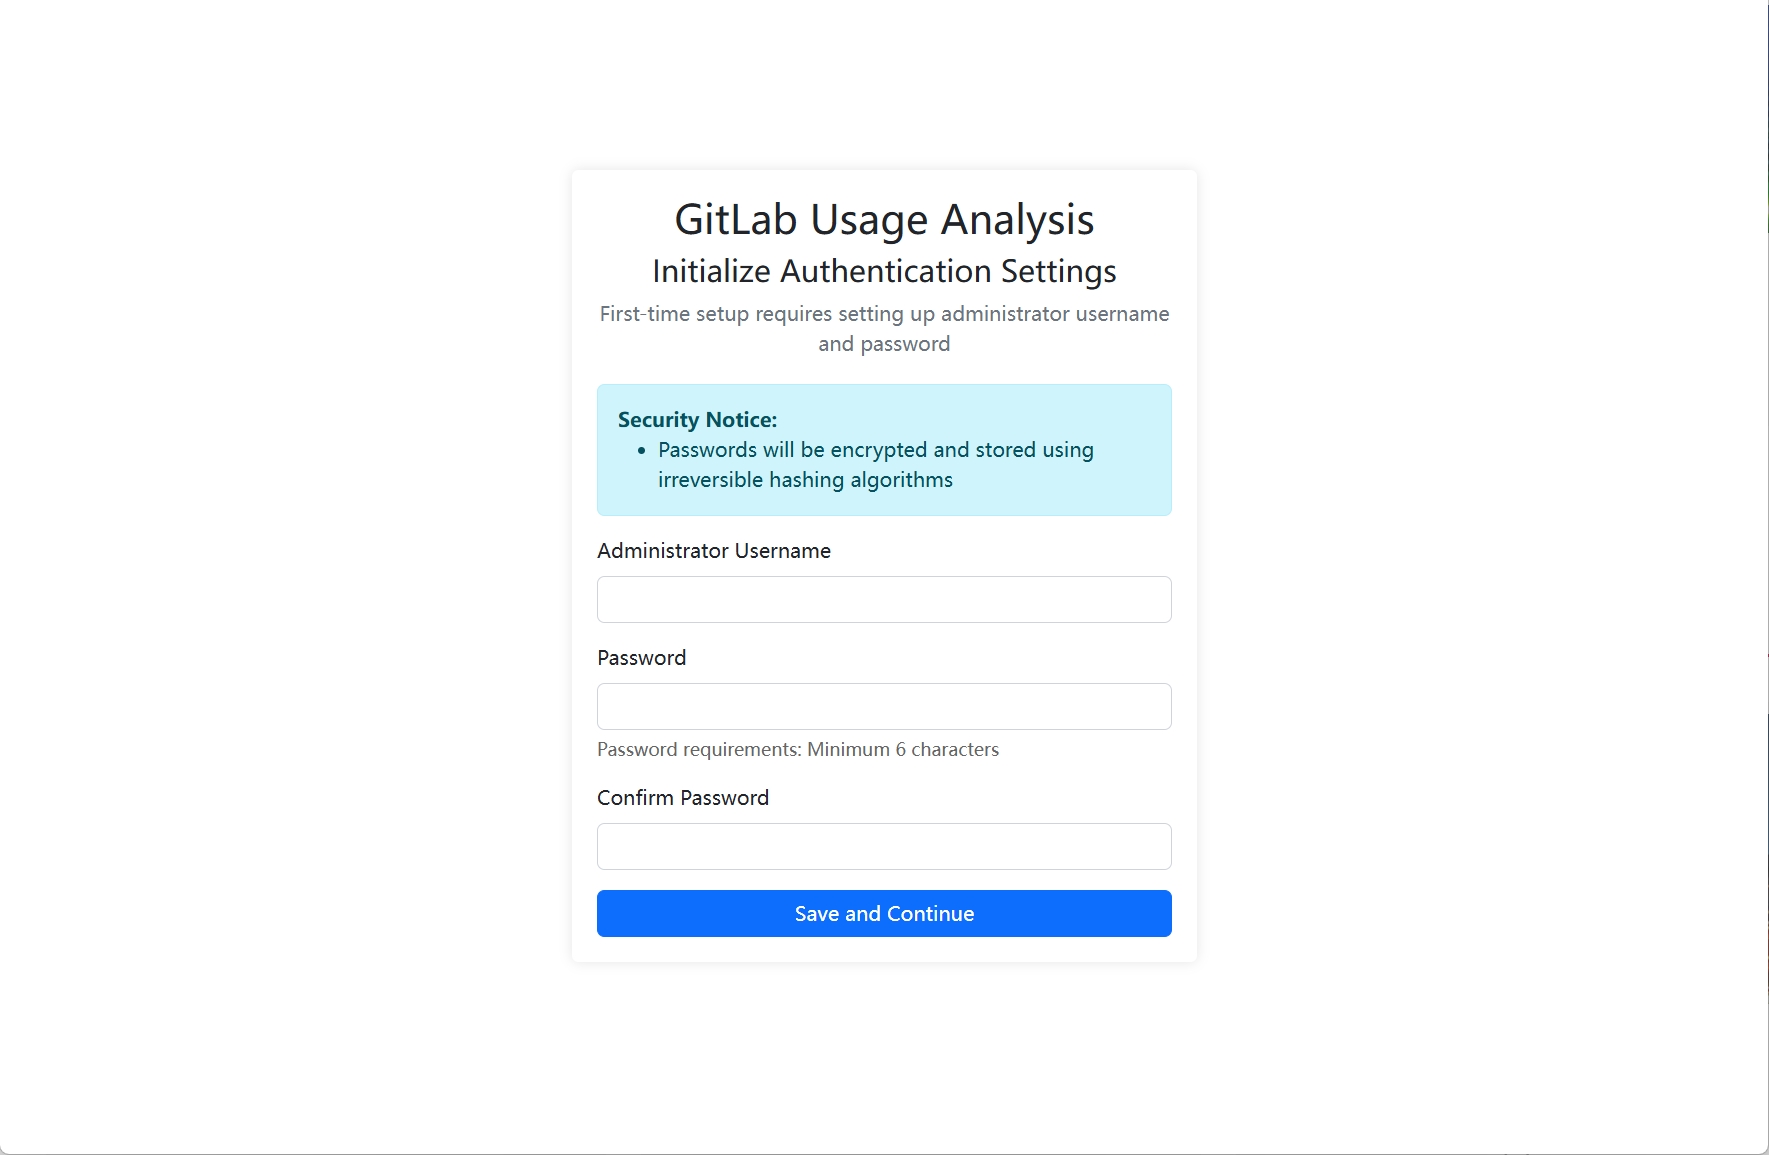
初始化密码完成后可以登录进入首页:
System Interface Description
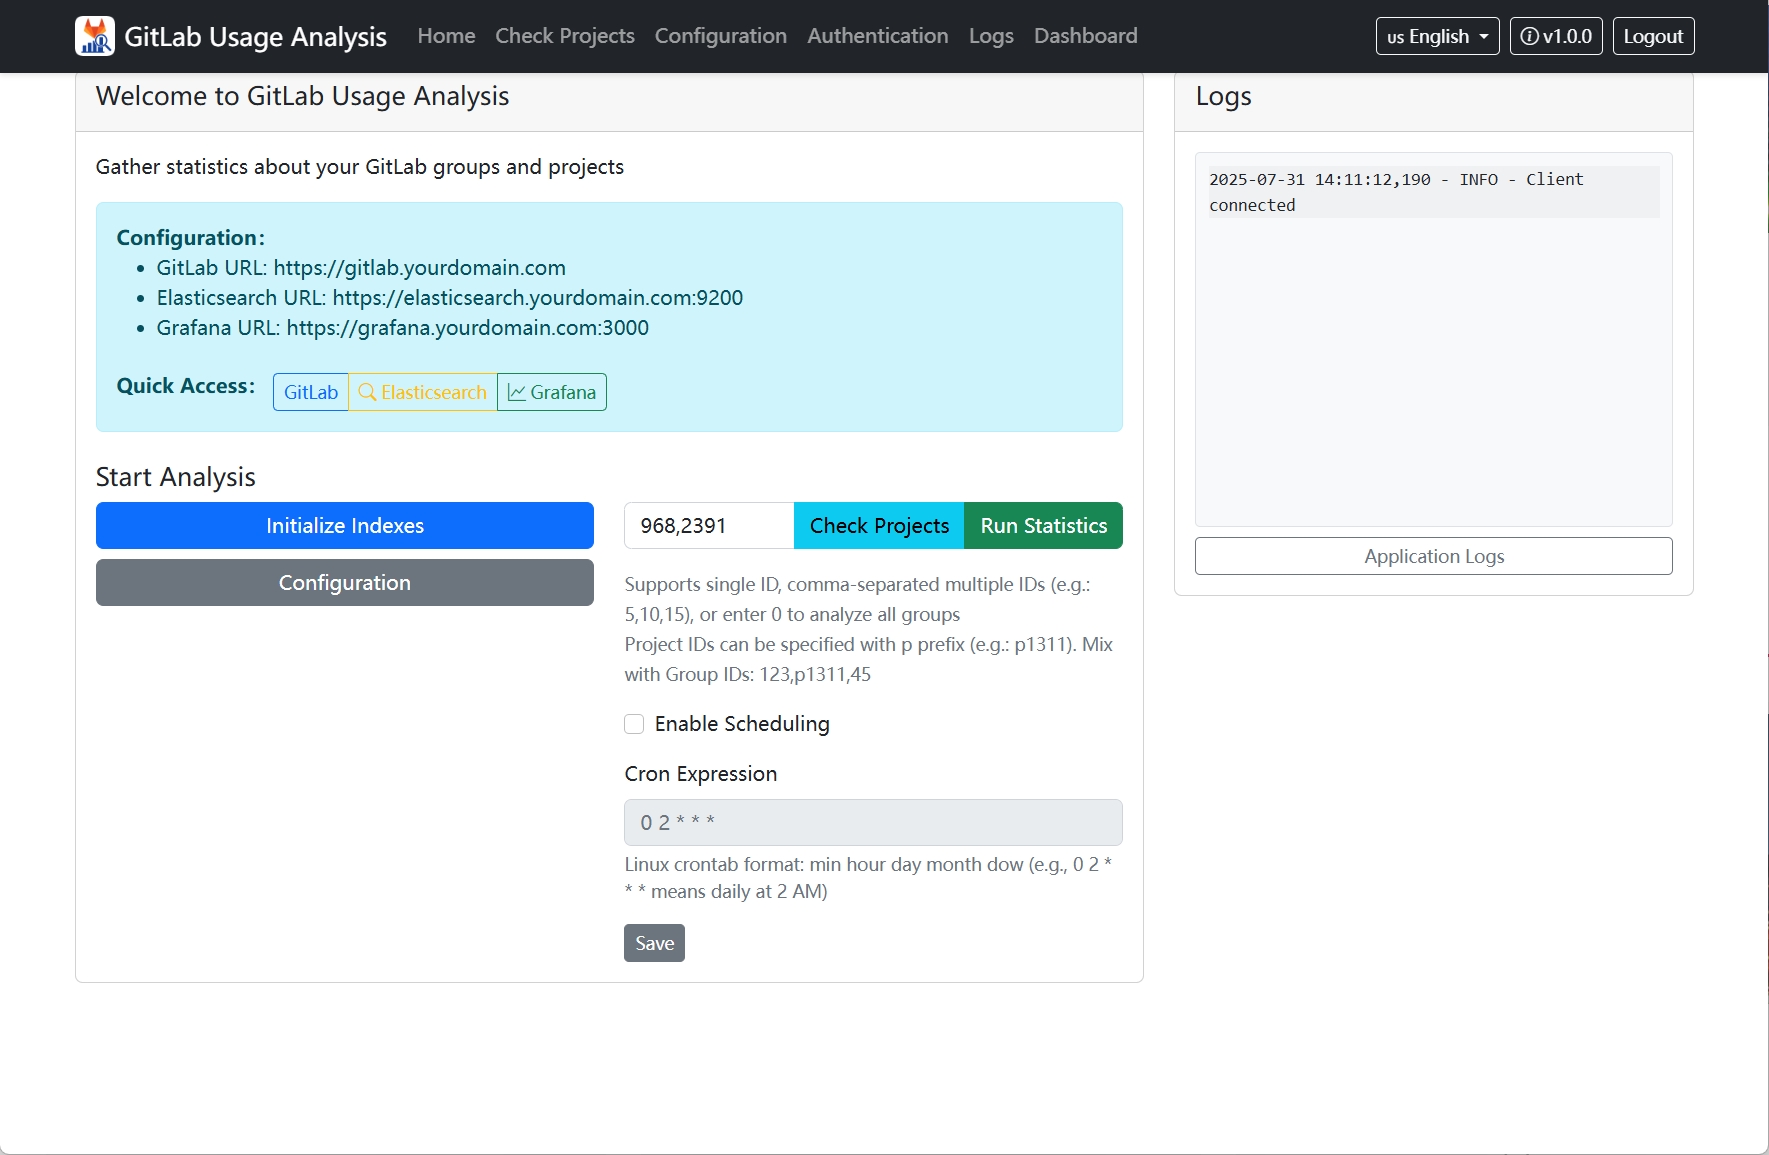
1. Homepage
Homepage displays system basic status and overview information, such as current GitLab/Elasticsearch/Grafana configuration.
功能说明:
- 初始化索引:为 Elasticsearch 初始化必要的索引,仅在第一次运行统计前操作
- 配置:跳转到配置页
- 检查项目:跳转到检查项目页,用于对群组或者项目的大提交数目分析
- 运行统计:运行核心分析程序
- 启用定时任务:周期性更新使用数据
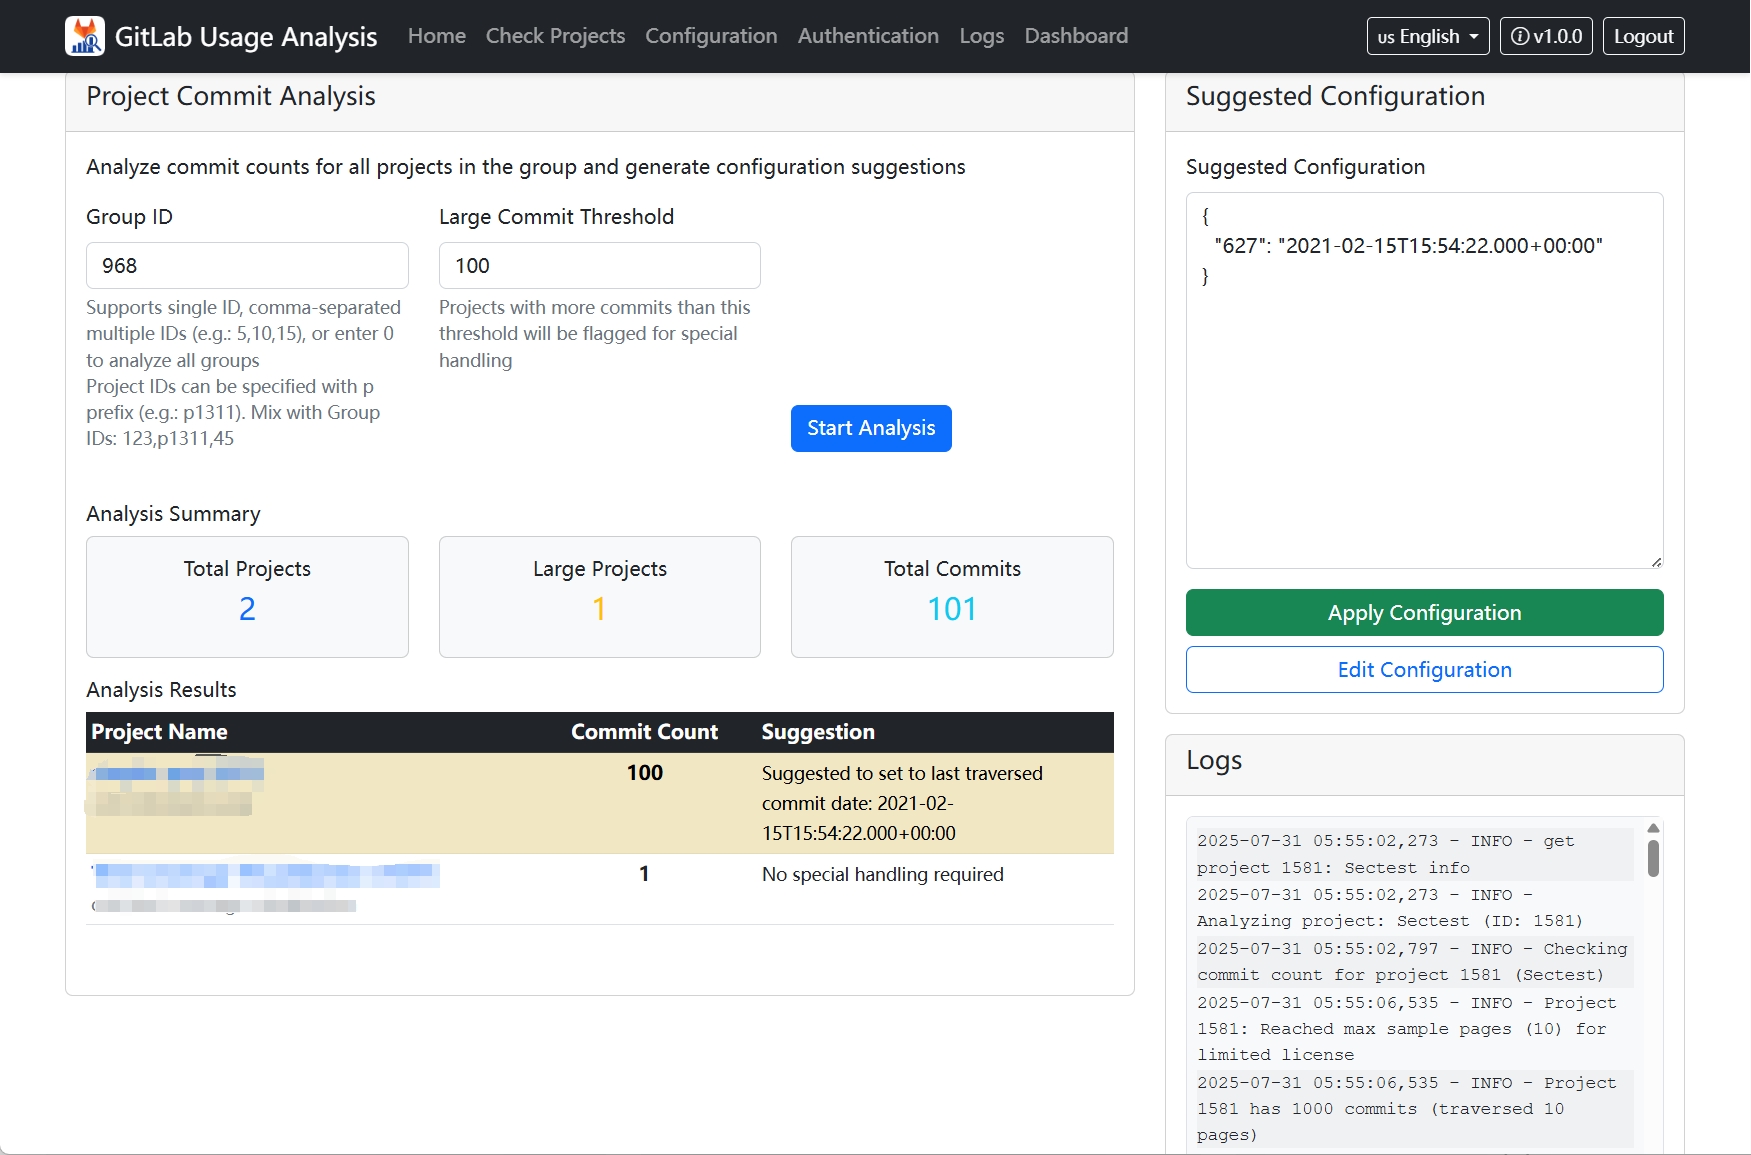
2. Project Check
Project check page is used to analyze GitLab projects before running statistics.
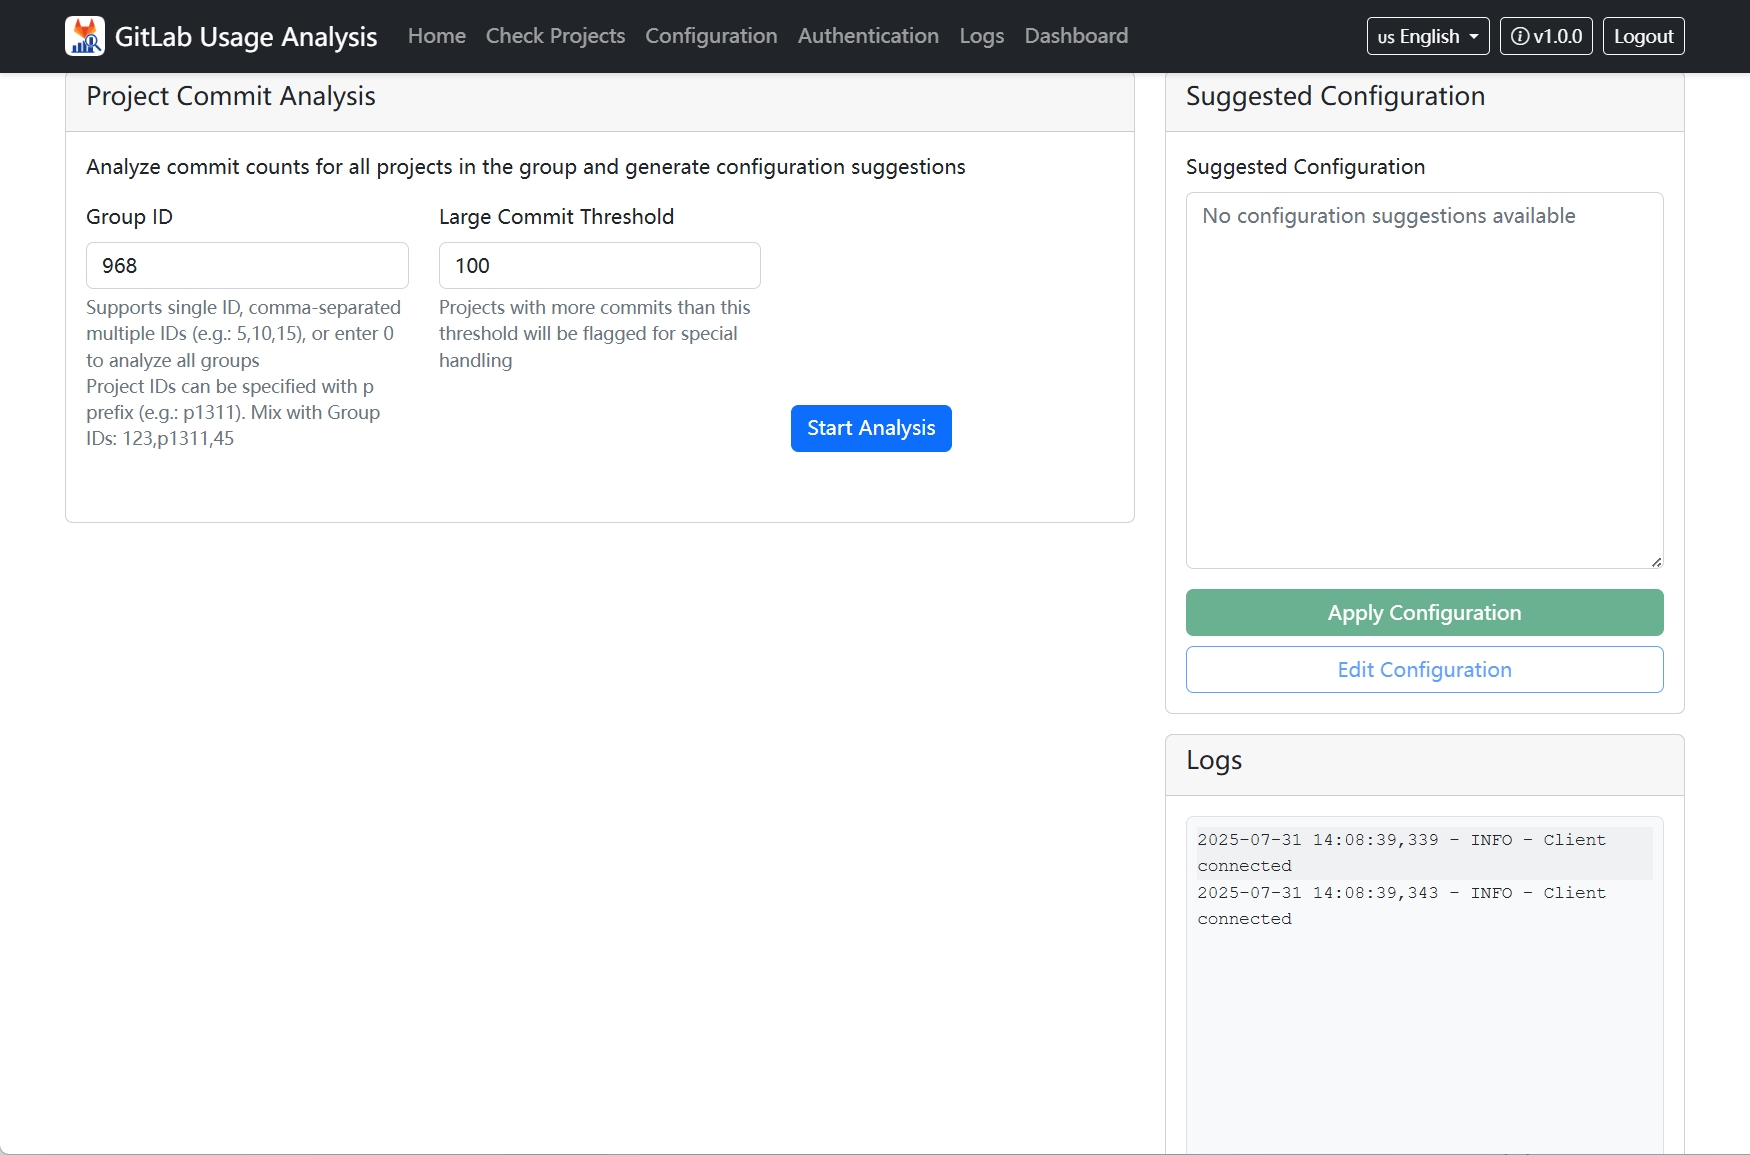
分析完成后的典型样例为:
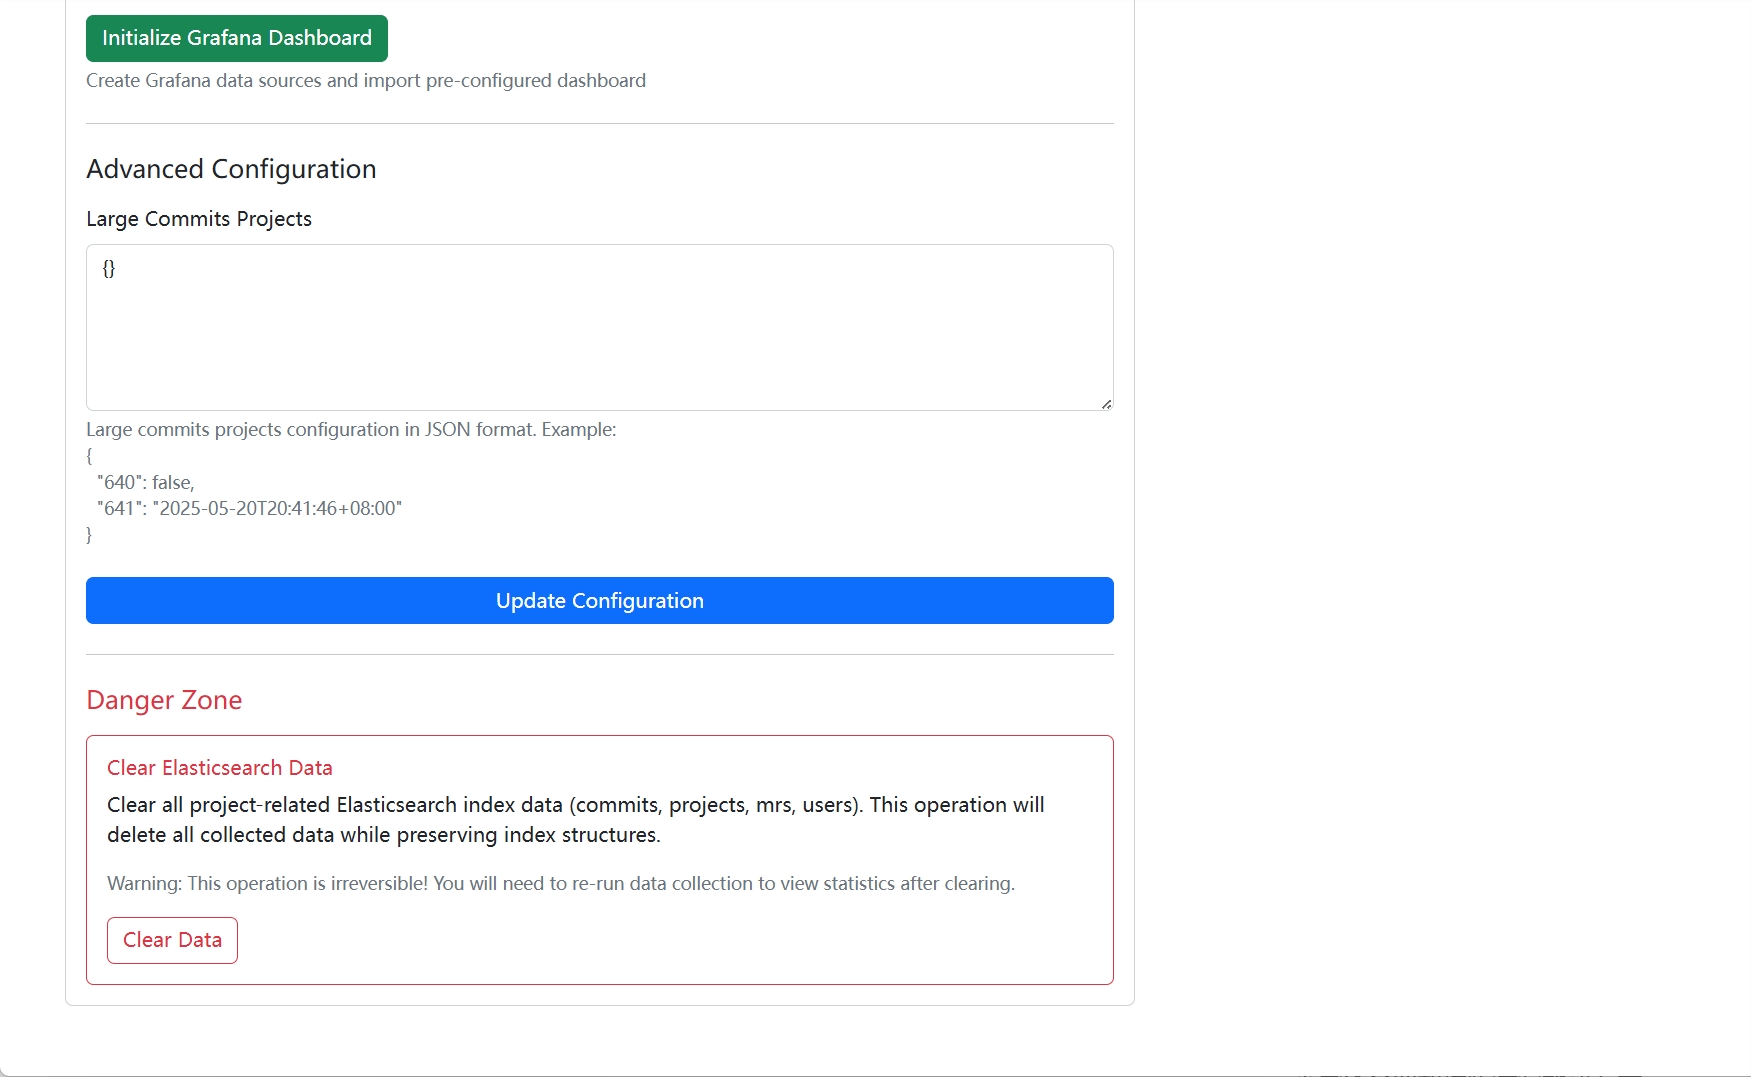
3. Configuration
Configuration page is used to manage various system settings.
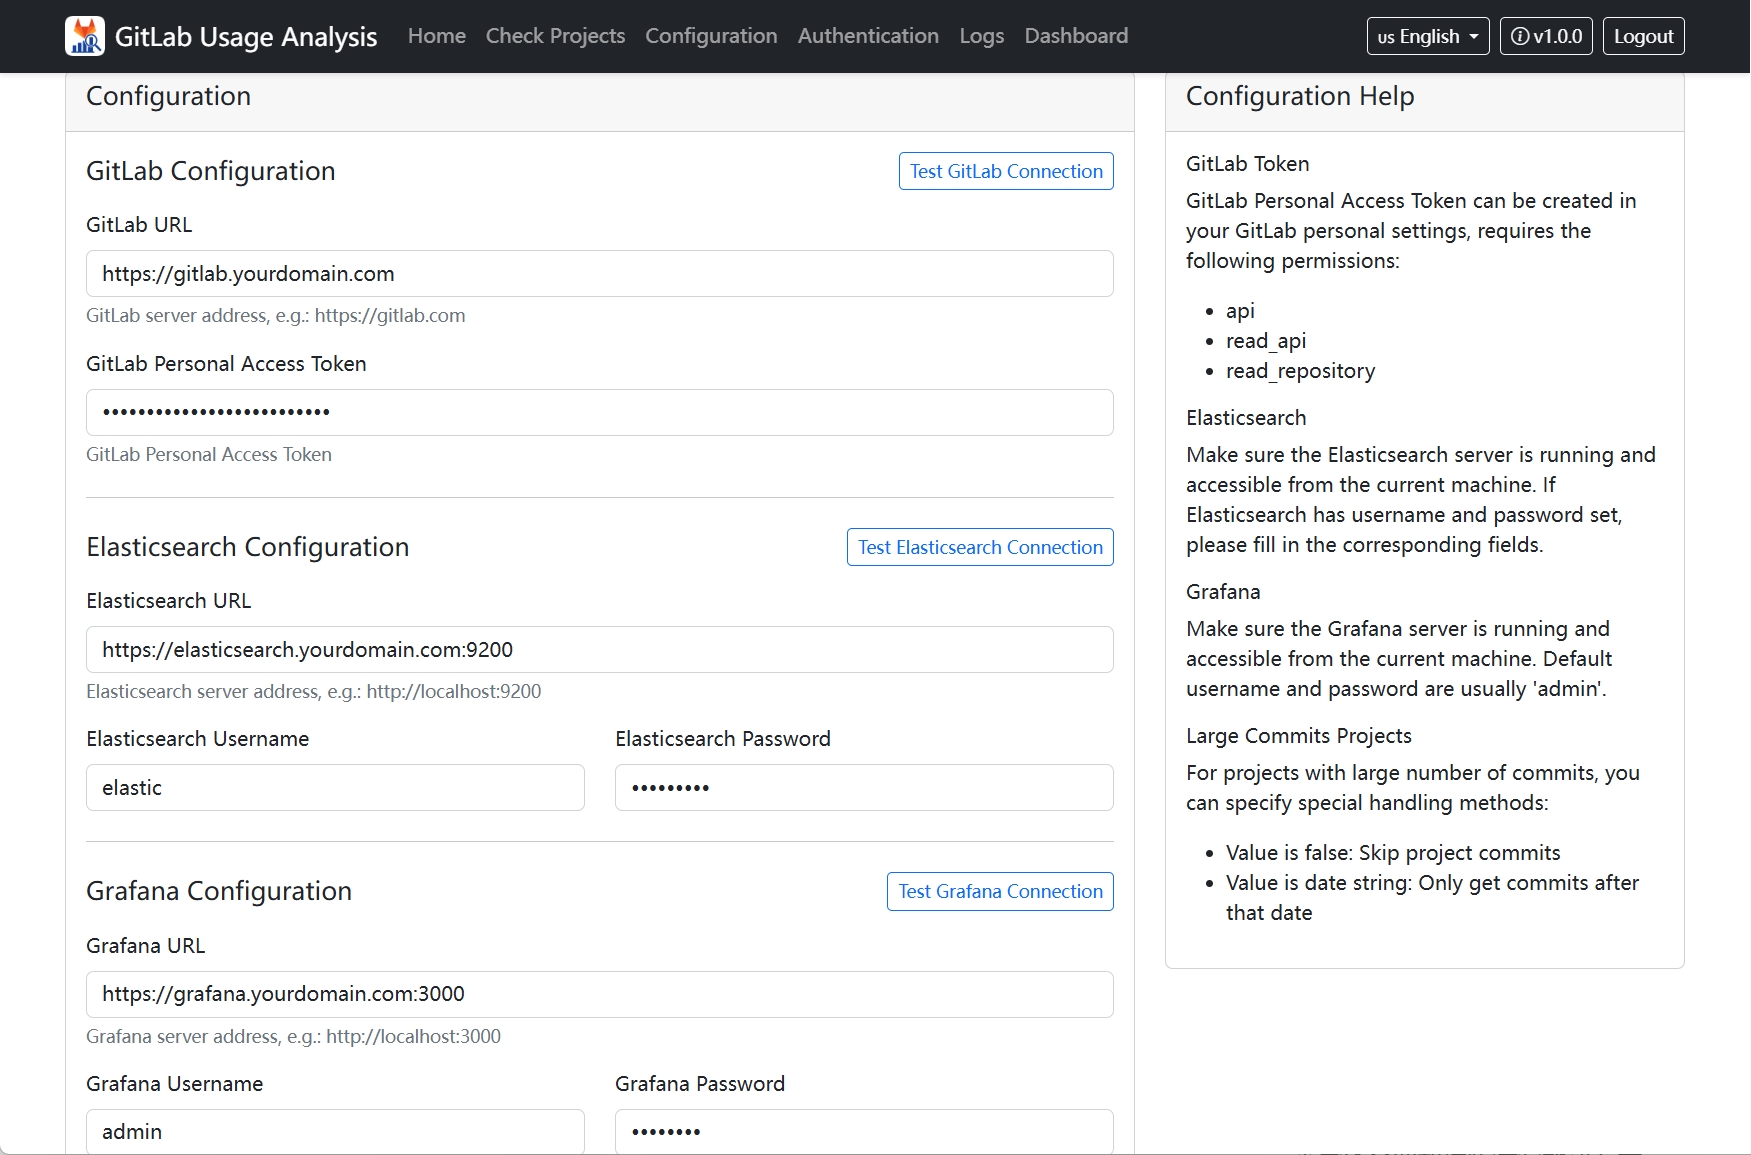
主要功能:
- GitLab 配置:设置 GitLab 服务器地址和访问令牌
- Elasticsearch 配置:配置 Elasticsearch 连接参数
- Grafana 配置:设置 Grafana 服务器信息
- 初始化 Grafana 仪表板:自动创建数据可视化仪表板
- 更新配置:保存所有配置更改
4. Authentication Configuration
Authentication configuration page manages system access permissions and licenses.
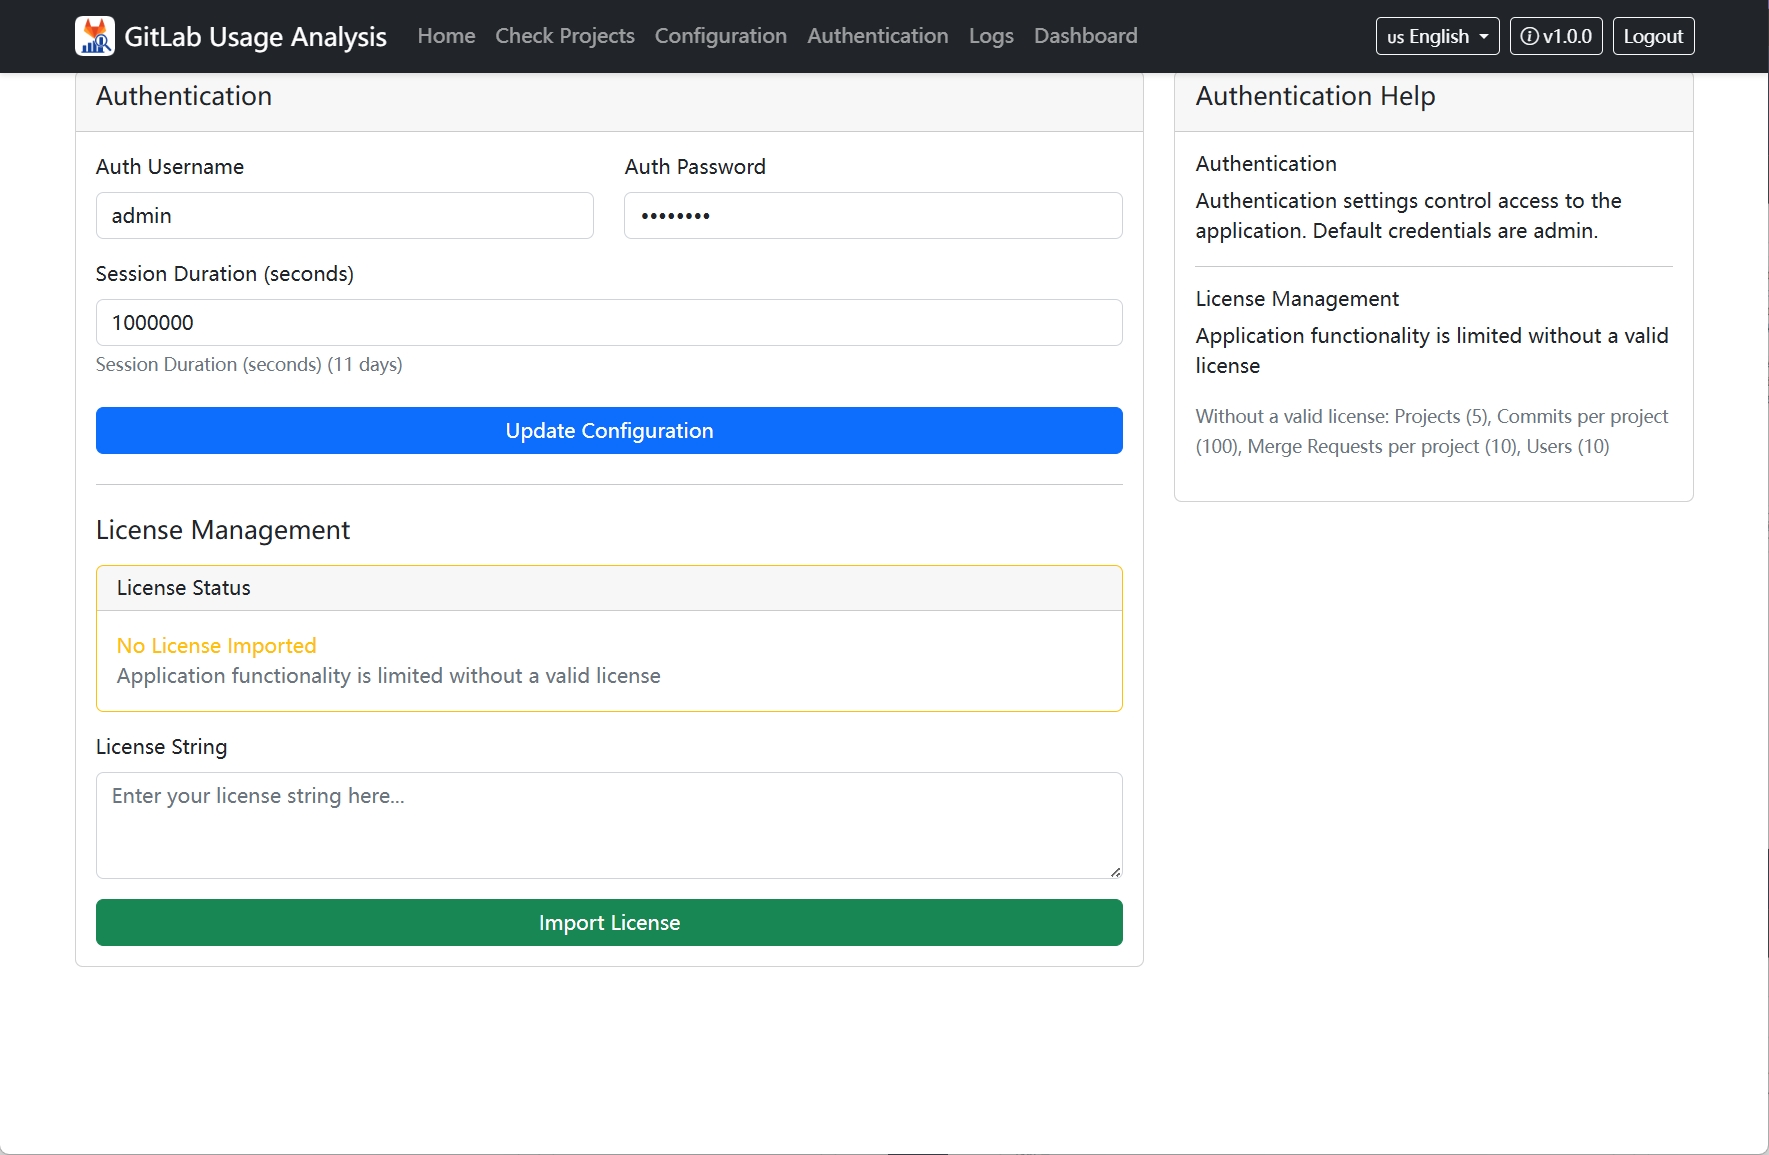
主要功能:
- 认证:管理员身份验证
- 许可证管理:
- 导入许可证:输入和激活许可证字符串
- 移除许可证:删除当前许可证
5. Logs
Logs page displays system operation logs and status information.
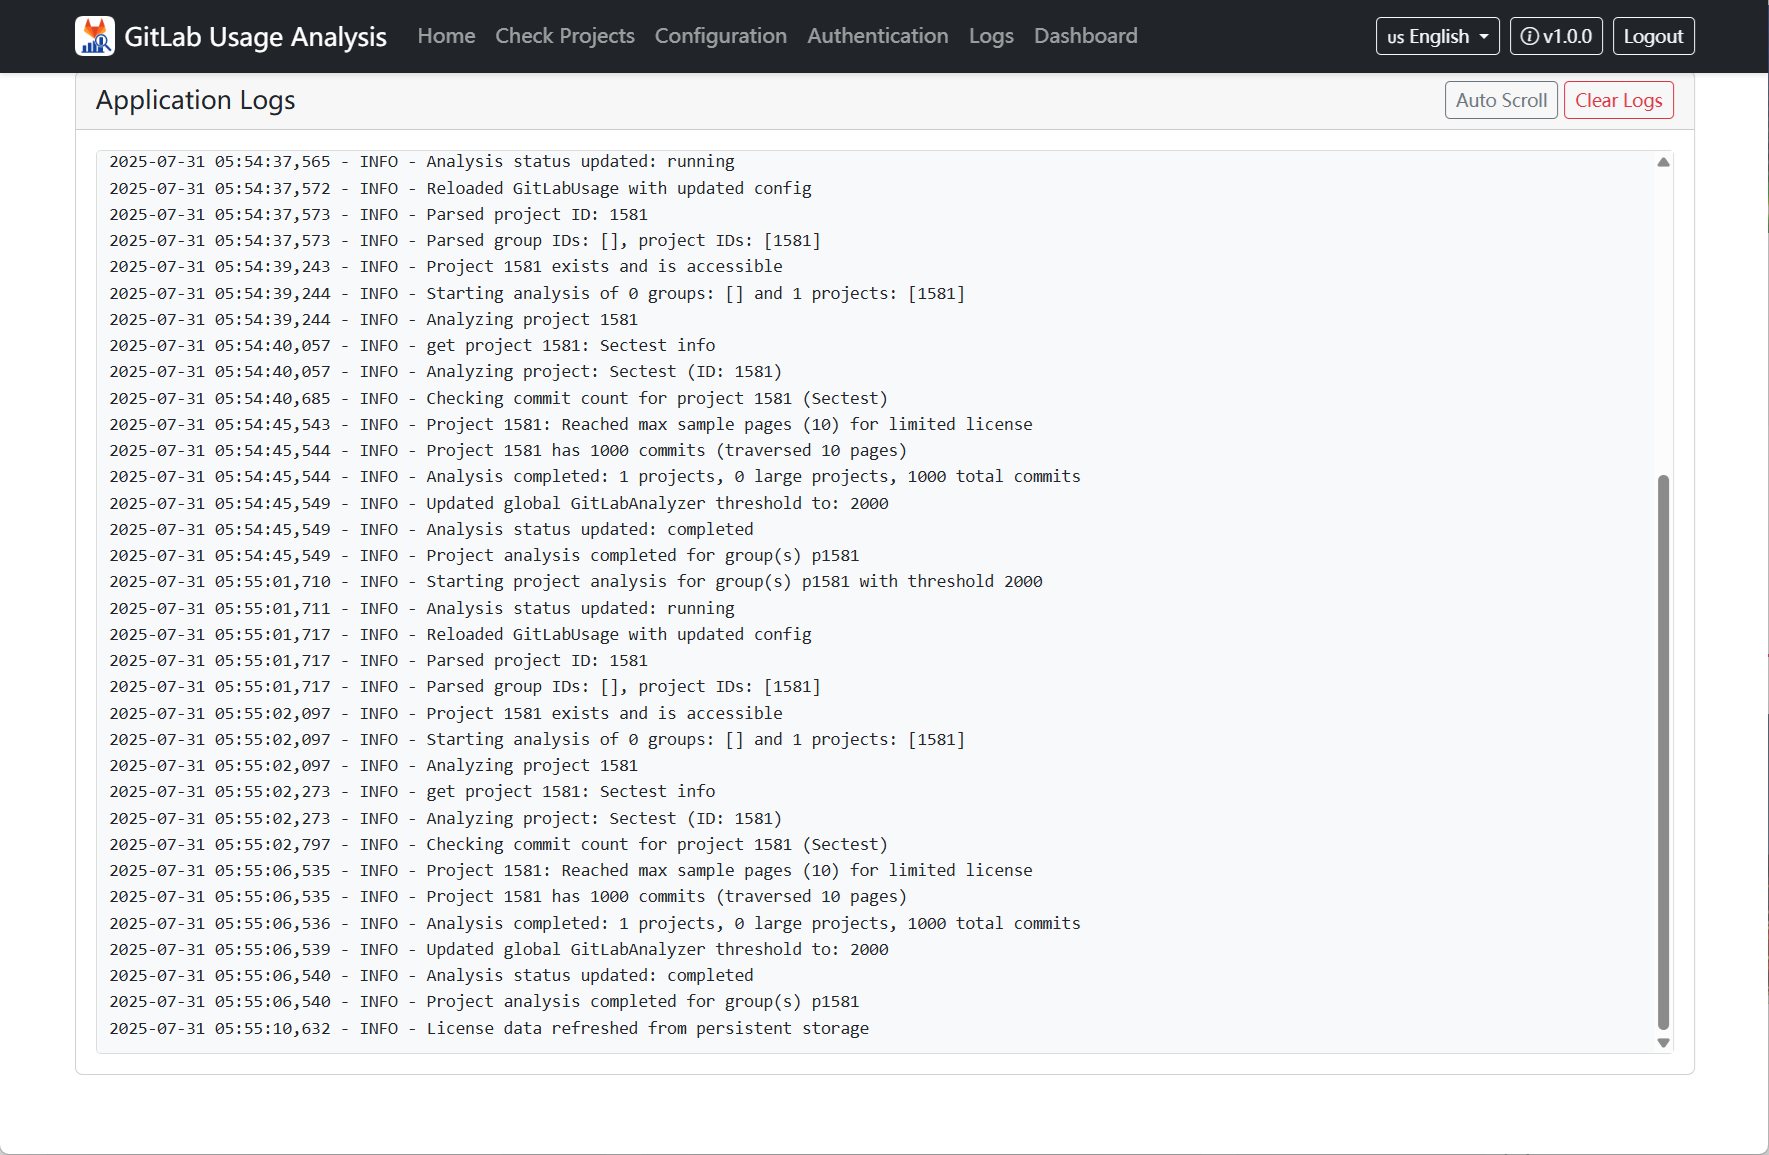
主要功能:
- 实时日志显示:查看系统实时运行日志
- 自动刷新:日志自动更新显示
6. Dashboard
Dashboard page provides data analysis and visualization functions.
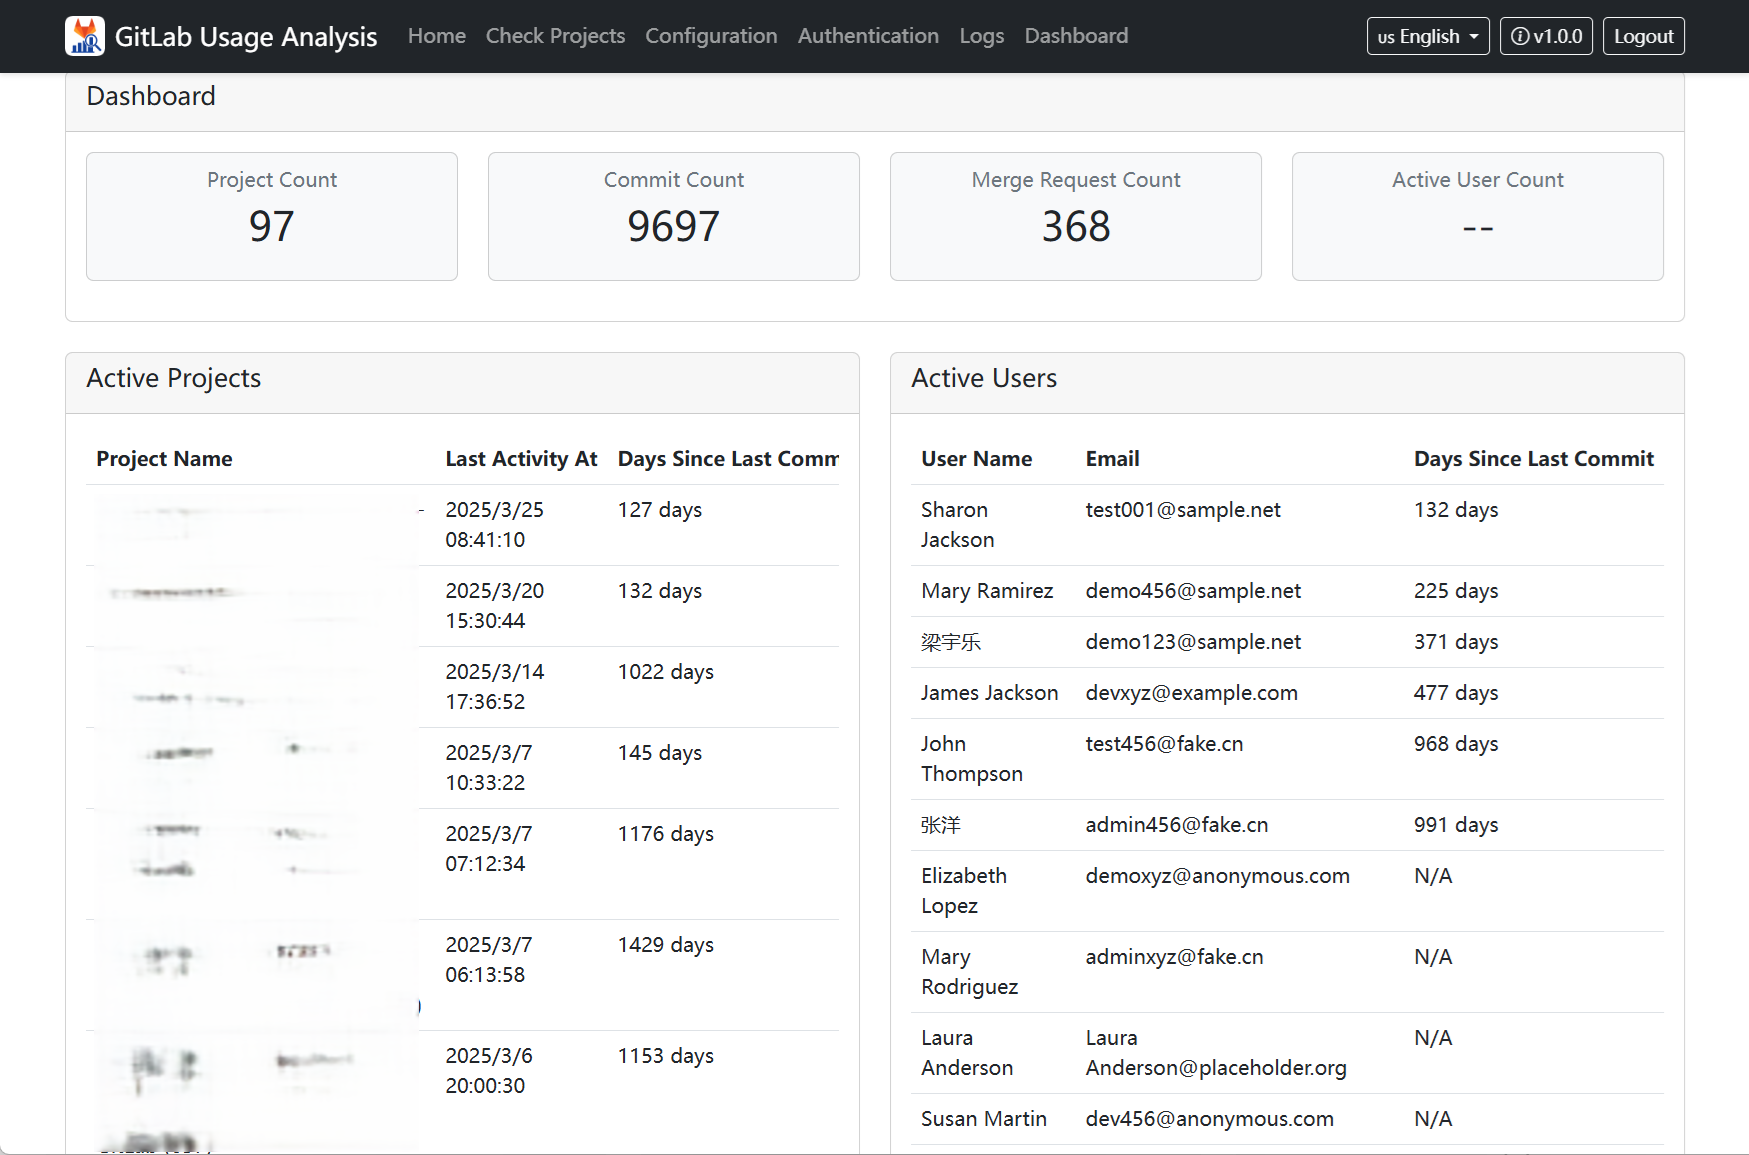
主要功能:
- 数据统计展示:显示项目、提交、合并请求、用户统计
- Grafana 集成:链接到 Grafana 详细仪表板
统计信息:
- 项目总数和活跃项目
- 提交次数和贡献者
- 合并请求数量和状态
- 用户活跃度分析
Usage Limitations
No License Mode
Without a valid license, the system will run in trial mode with the following limitations:
- Maximum 5 projects analysis
- Maximum 100 commit records per project
- Maximum 10 merge requests per project
- Maximum 10 user accounts
License Mode
After importing a valid license, all usage restrictions will be lifted, you can:
- Analyze unlimited number of projects
- Collect complete commit history
- Analyze all merge request data
- Support unlimited number of users
Appendix
Grafana Deployment
- 创建数据路径,并授予所有用户读写权限:
mkdir -p /srv/grafana/data chmod -R a+rw /srv/grafana/data - 启动 Grafana:
docker run -itd --restart always --name=grafana \ --net=host \ -p 3000:3000 \ -v /srv/grafana/data:/var/lib/grafana \ -e "GF_LOG_LEVEL=debug" \ grafana/grafana:11.4.0 - 访问 Grafana:
- 访问地址:
http://<PUBLIC_IP_OF_YOUR_VM>:3000 - 默认用户名密码为
admin/admin,请修改密码
- 访问地址:
Elasticsearch Deployment
- 为 Elasticsearch 创建数据持久化目录和配置文件目录,并授予所有用户读写权限:
mkdir -p /srv/elasticsearch/data /srv/elasticsearch/config chmod -R a+rw /srv/elasticsearch - 在
/srv/elasticsearch/config/目录下创建elasticsearch.yml配置文件:cat >>> /srv/elasticsearch/config/elasticsearch.yml << EOF network.host: 0.0.0.0 node.name: single-node cluster.name: es-docker-cluster path.data: /usr/share/elasticsearch/data path.logs: /usr/share/elasticsearch/logs discovery.type: single-node bootstrap.memory_lock: true EOF - 使用以下命令启动 Elasticsearch,并绑定数据目录和配置文件:
docker run -itd --restart always --name es \ -p 8080:9200 \ -e "xpack.security.enabled=true" \ -e "ELASTIC_USERNAME=elastic" \ -e "ELASTIC_PASSWORD=PassWord" \ -e "ES_JAVA_OPTS=-Xms4g -Xmx4g" \ -v /srv/elasticsearch/data:/usr/share/elasticsearch/data \ -v /srv/elasticsearch/config/elasticsearch.yml:/usr/share/elasticsearch/config/elasticsearch.yml:ro \ docker.elastic.co/elasticsearch/elasticsearch:8.17.0 - 访问测试:
curl -u elastic:PassWord http://localhost:8080得到如下内容,表示 Elasticsearch 运行正常:
{
    "name": "single-node",
    "cluster_name": "es-docker-cluster",
    "cluster_uuid": "oO3mfjYWTZ6VZFSClDiSLA",
    "version": {
        "number": "8.17.0",
        "build_flavor": "default",
        "build_type": "docker",
        "build_hash": "2b6a7fed44faa321997703718f07ee0420804b41",
        "build_date": "2024-12-11T12:08:05.663969764Z",
        "build_snapshot": false,
        "lucene_version": "9.12.0",
        "minimum_wire_compatibility_version": "7.17.0",
        "minimum_index_compatibility_version": "7.0.0"
    },
    "tagline": "You Know, for Search"
}